Market Overview: Bitcoin Futures
The Bitcoin futures end the Q3 2022 (3rd quarter of 2022) 72% down from all-time highs. During Q2 2022, the Bitcoin price experienced a large sell-off, but bears did not get good follow through selling during Q3 2022: the price closed above Q2 2022 close. The price will probably test $30000 within the next 9-month period.
Bitcoin futures
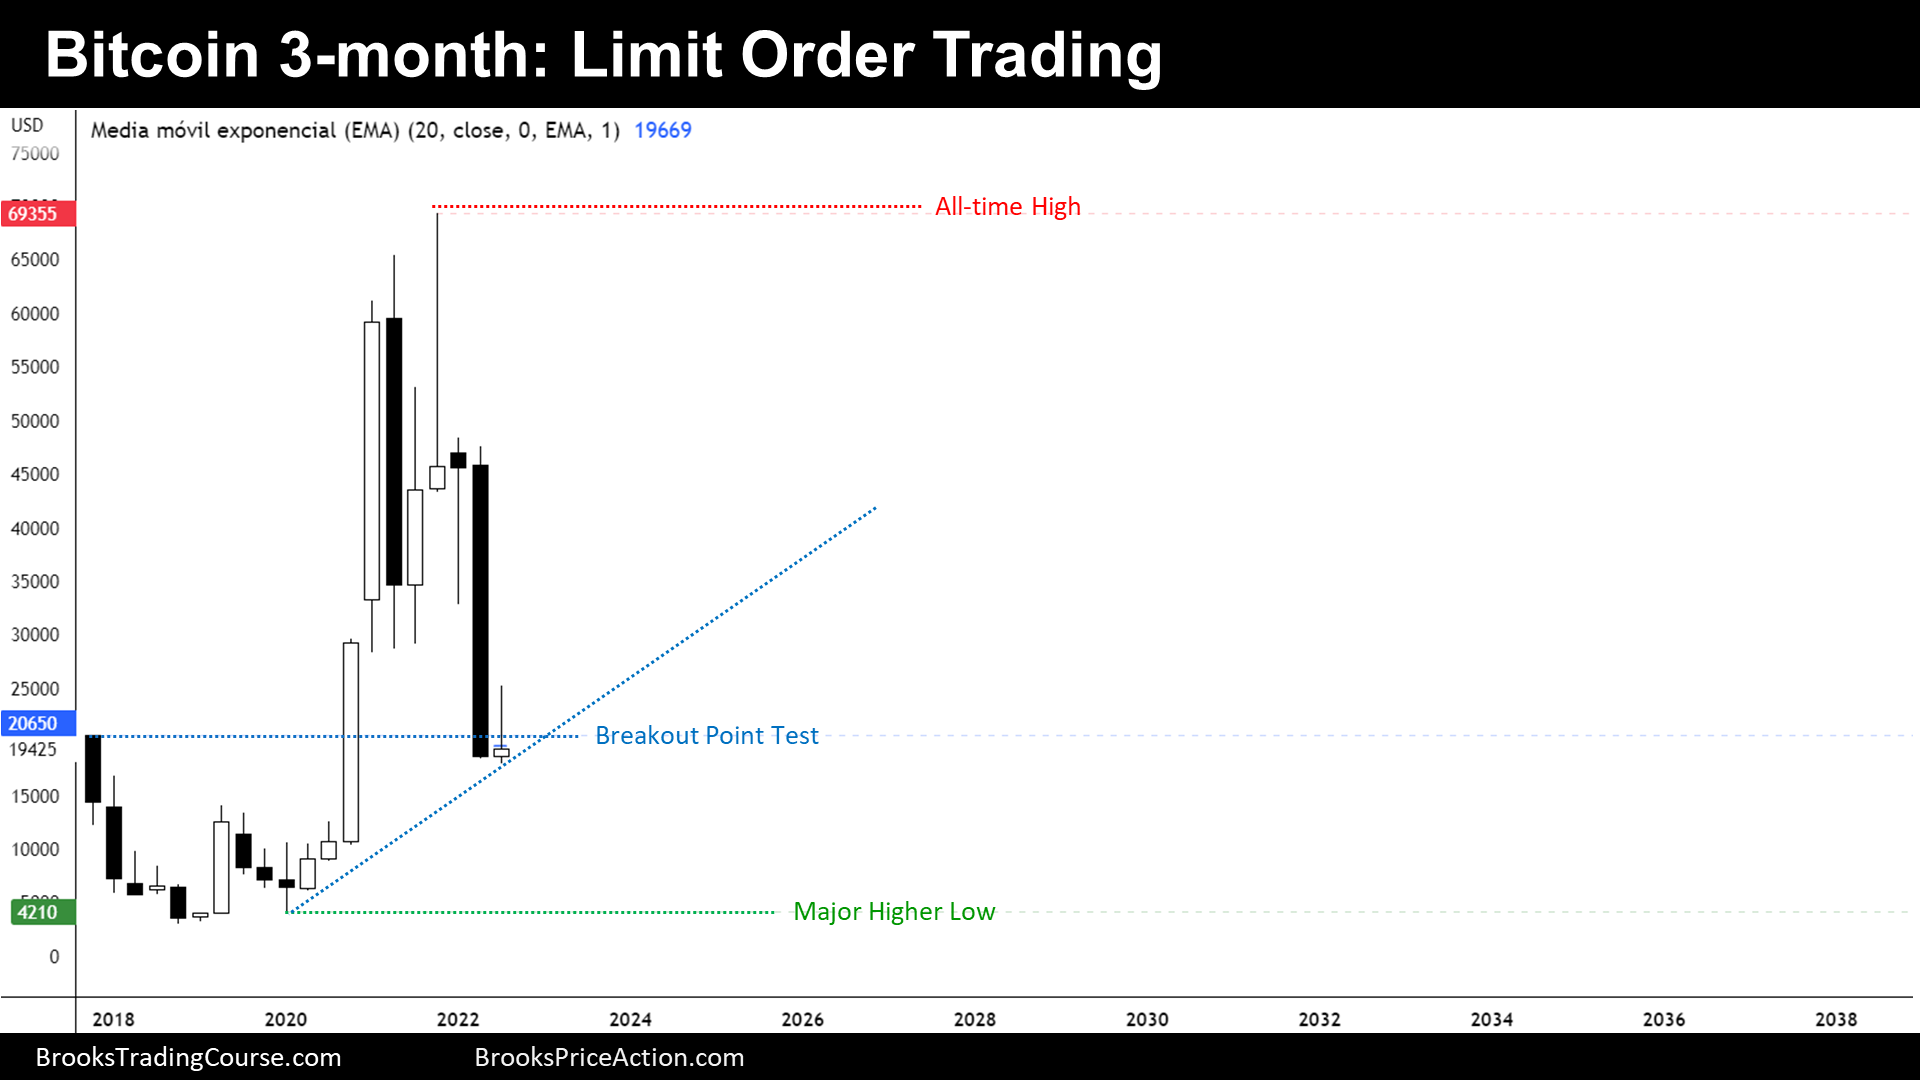
The Quarterly chart of Bitcoin futures

- This quarter’s candlestick on the quarterly Bitcoin Futures chart was a small bull doji with a big tail above.
- A quarterly chart gives us a fair behavioral glimpse of the biggest institutions.
- This past bar was the 20th bar of the chart.
- For the first time on CME Bitcoin Futures, we can get the 20-bar exponential moving average (EMA 20) price, which is 19670. Traders consider that the EMA 20 price is a fair price.
- Observing this chart, we can recognize that traders buying below things or selling above things, make money. This is what we call limit order trading or trading range trading.
- Bulls want a continuation of a bull trend from the EMA 20, but since there are so much trading range price action, we should expect selling pressure above EMA 20 for a while.
- It is unlikely that bears reach their major higher low target because the bull breakout (Q4 2020 and Q1 2021) was forceful. More likely, they will test the 1st ever quarter close (2017 close/Q4 2017 close) and then reverse up.
- There is an 80% probability that anyone who bought below the Q1 2022 bear doji can avoid a loss: the price should get back to their entry point and give them a chance to exit breakeven. Moreover, anyone buying below the Q2 2022 bear breakout should make money.
- Since we are near the EMA 20 and since after the first 20 quarters the price it is right near its opening price, we should expect the Bitcoin price to gravitate around here during the next 10-20 quarters. Traders should expect sideways trading. The September bull reversal might be an early sign of a future formation of a Triangle.
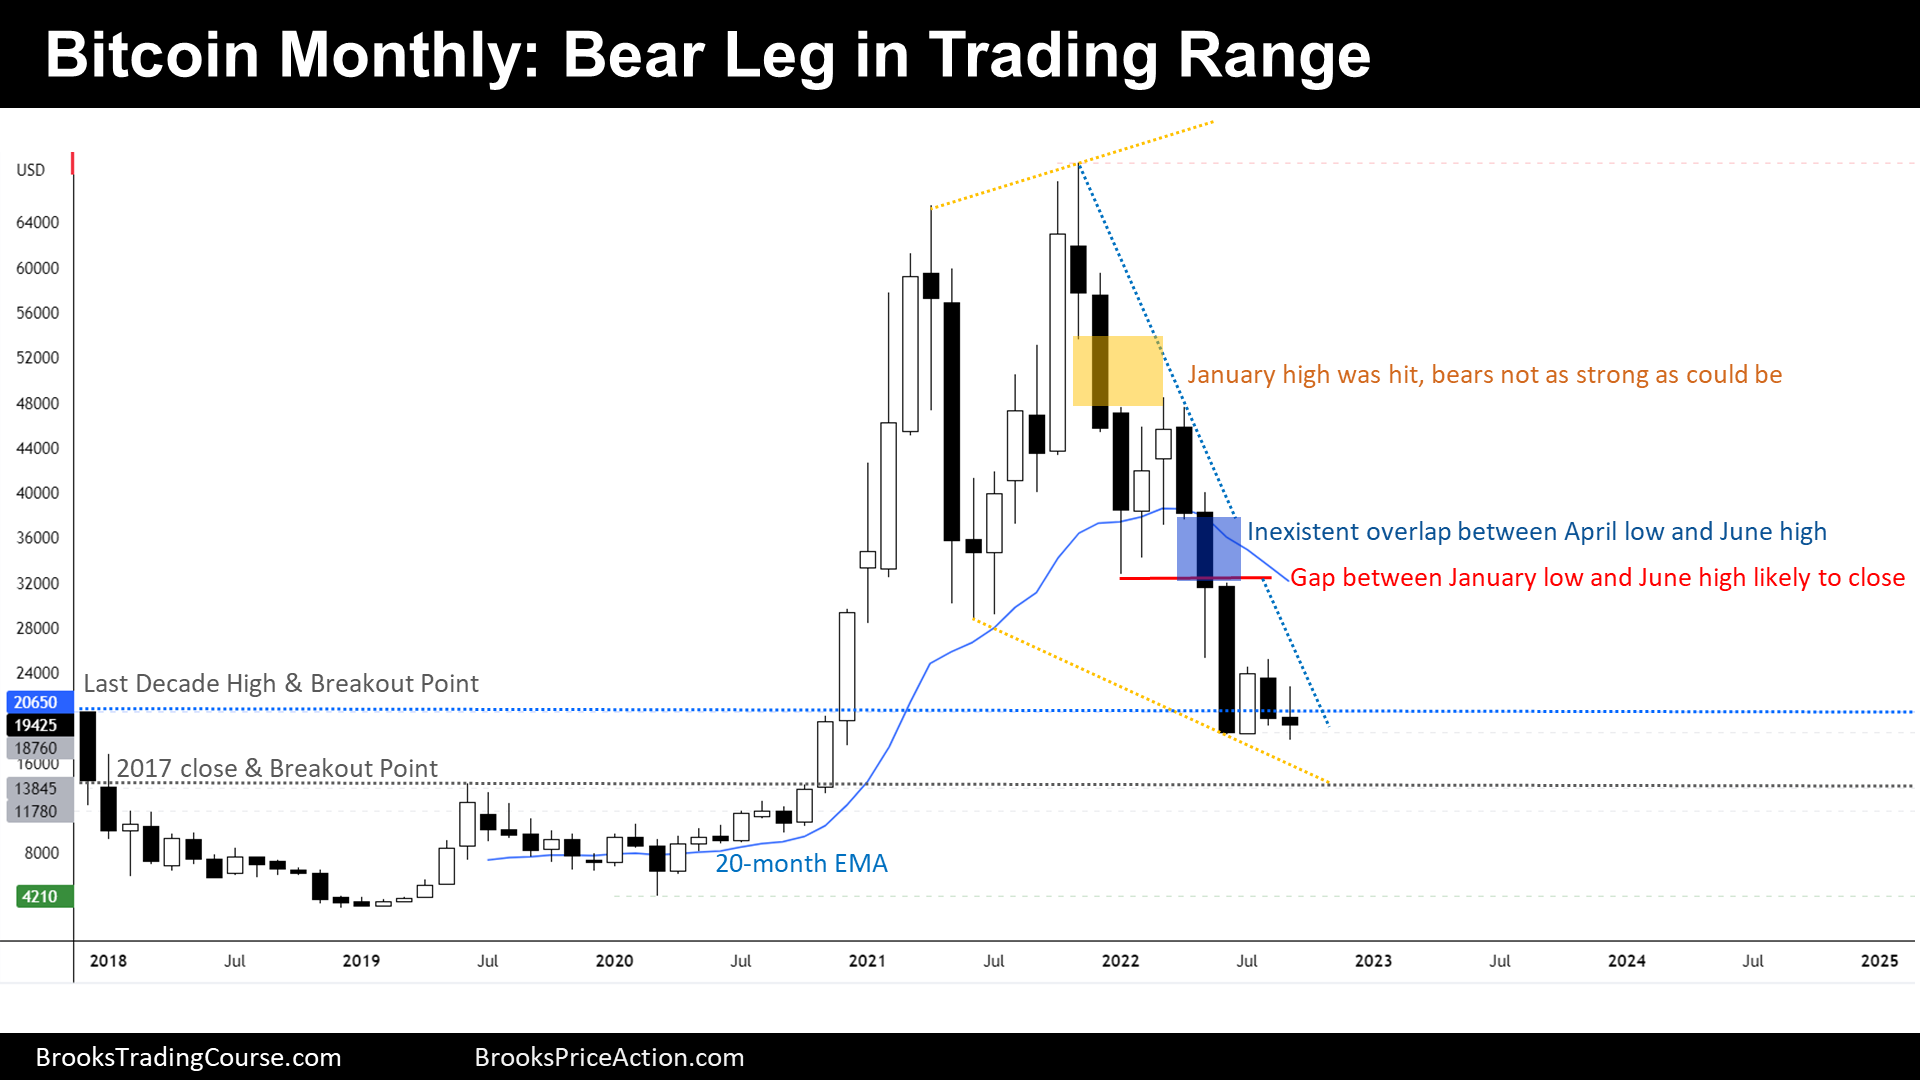
The Monthly chart of Bitcoin futures

- This month’s candlestick on the monthly chart is a bear doji. This is the follow-through bar of a Low 1 sell setup. There is a conspicuous tail below, signaling bullish pressure. More likely, it just represents profit taking from bears.
- During the prior monthly report, we have said that September would be a bear bar with a tail below, a bull bar with a tail above or a doji. It was a bear doji. In short, we were expecting bullish pressure below the August low and bearish pressure during a reversal up. That is what happened.
- The price is contained within a tight bear channel. The first reversal up of a tight bear channel will probably fail.
- On this chart, we highlight that the bears were not strong during early stages of the tight bear channel. Such behavior is more typical of bear legs in trading ranges than of tight channels in bear breakouts.
- But while the gap between the January low and the June high is open, bears remain in control and bulls should be cautious betting on swing trades. It is true that this gap will be probably closed at some point, but remember that there are trapped bulls there and will sell their bad trades on their first opportunity, provoking selling pressure.
- Bears are close to their targets, that might act as a magnet. They have the odds on their side to a continuation down, but their risk is big. Most bears should wait a pullback before selling.
- Since September is a doji, we should expect bull pressure during October, even if the price continues to trend down.
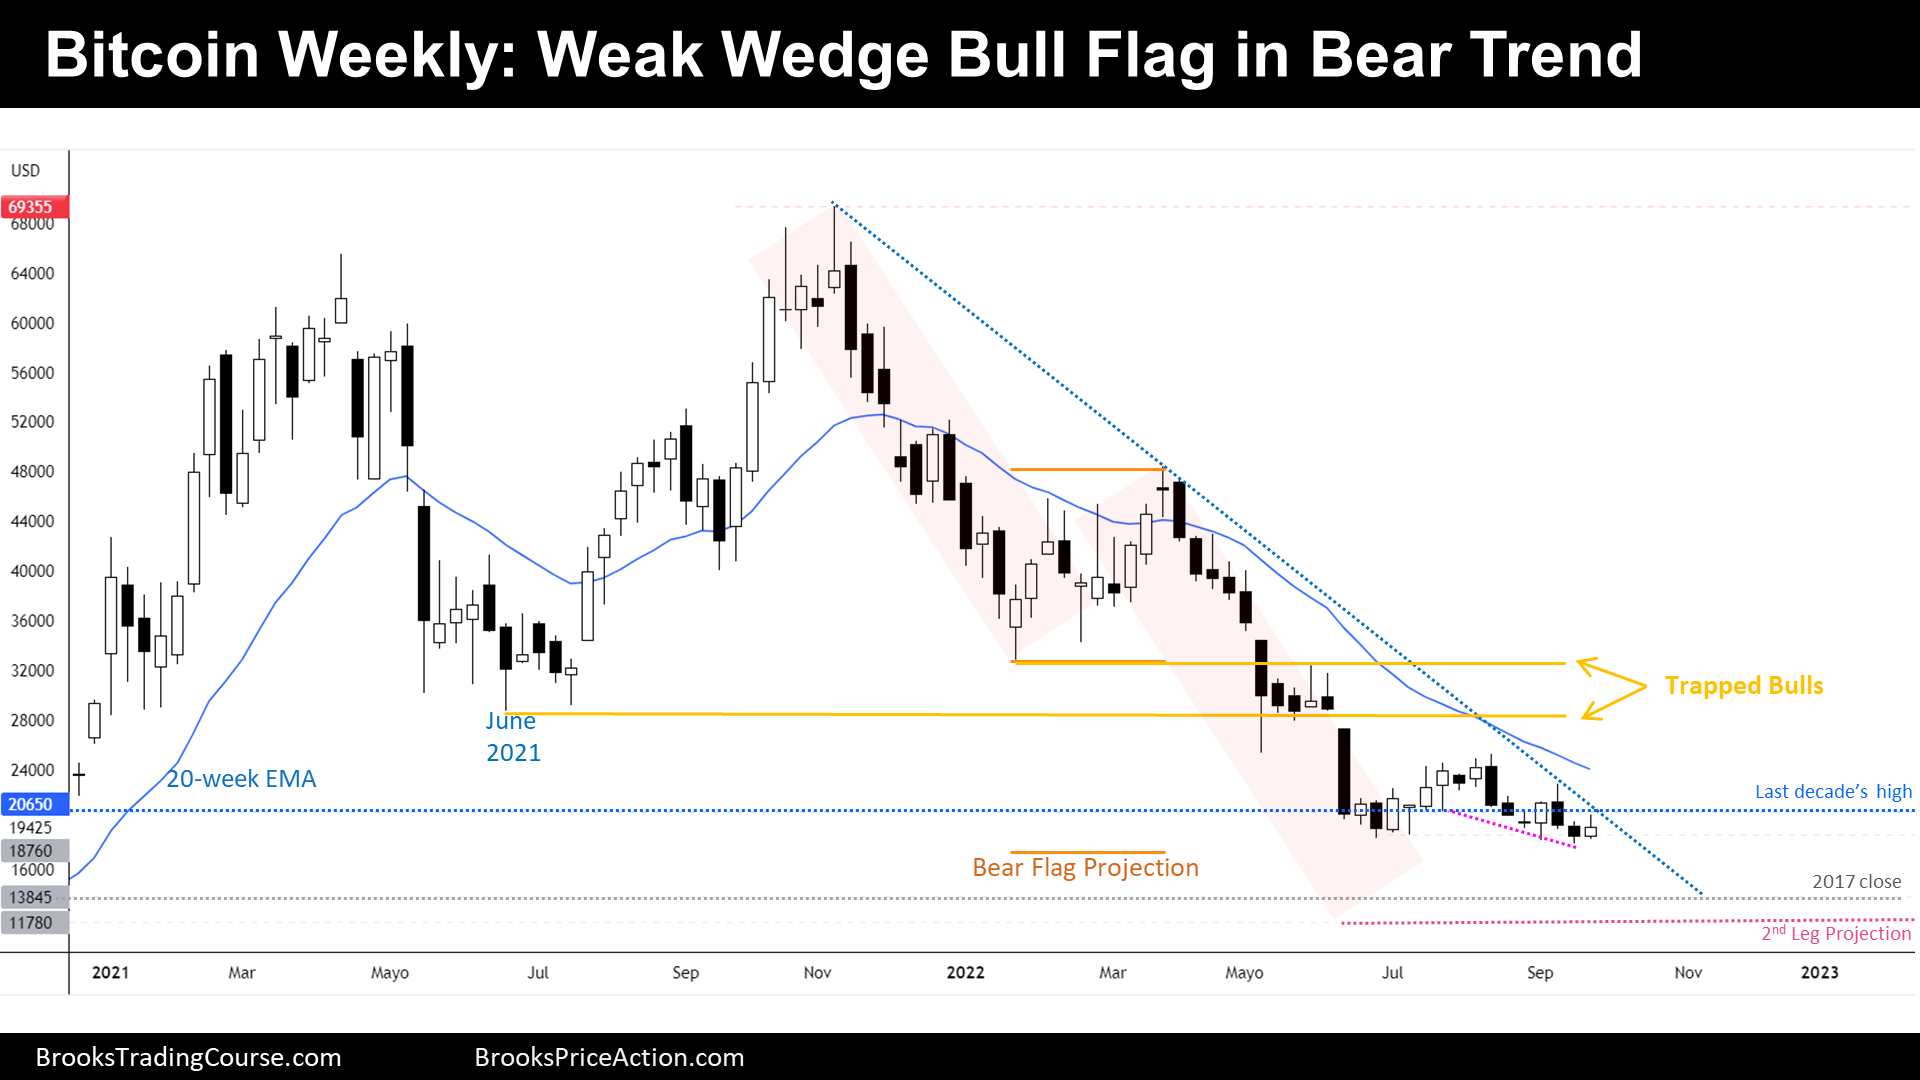
The Weekly chart of Bitcoin futures

- This week’s candlestick on the weekly chart was a bull bar with a big tail above. It tested the high of the prior week, and there were sellers above.
- By reversing up this week, we can draw a wedge bottom. A wedge bottom is a bull flag and a reversal pattern.
- However, as we are mentioning during the report, there are open gaps above that meanwhile remain open, it probably means that bears still control the market forces.
- Even if there were a bull reversal from here, the potential up is not tremendous because trapped bulls will be encountered soon on a reversal up, and they will create, presumably, strong selling pressure.
- Bears are near their targets, and that means that their reward potential is really limited. For any bear willing to sell, it would be much easier to structure a trade around the trapped bulls zone.
- This week’s candlestick it is not a good sell signal bar for the bears, neither a good buy signal bar for the bulls. We should expect a continuation down of the bear channel; however, traders should be open to a strong bull reversal anytime. They should remember that on the quarterly timeframe, there are big institutions that can erase an important part of the selling pressure.
Market analysis reports archive
You can access all weekend reports on the Market Analysis page.

