Market Overview: Bitcoin Futures
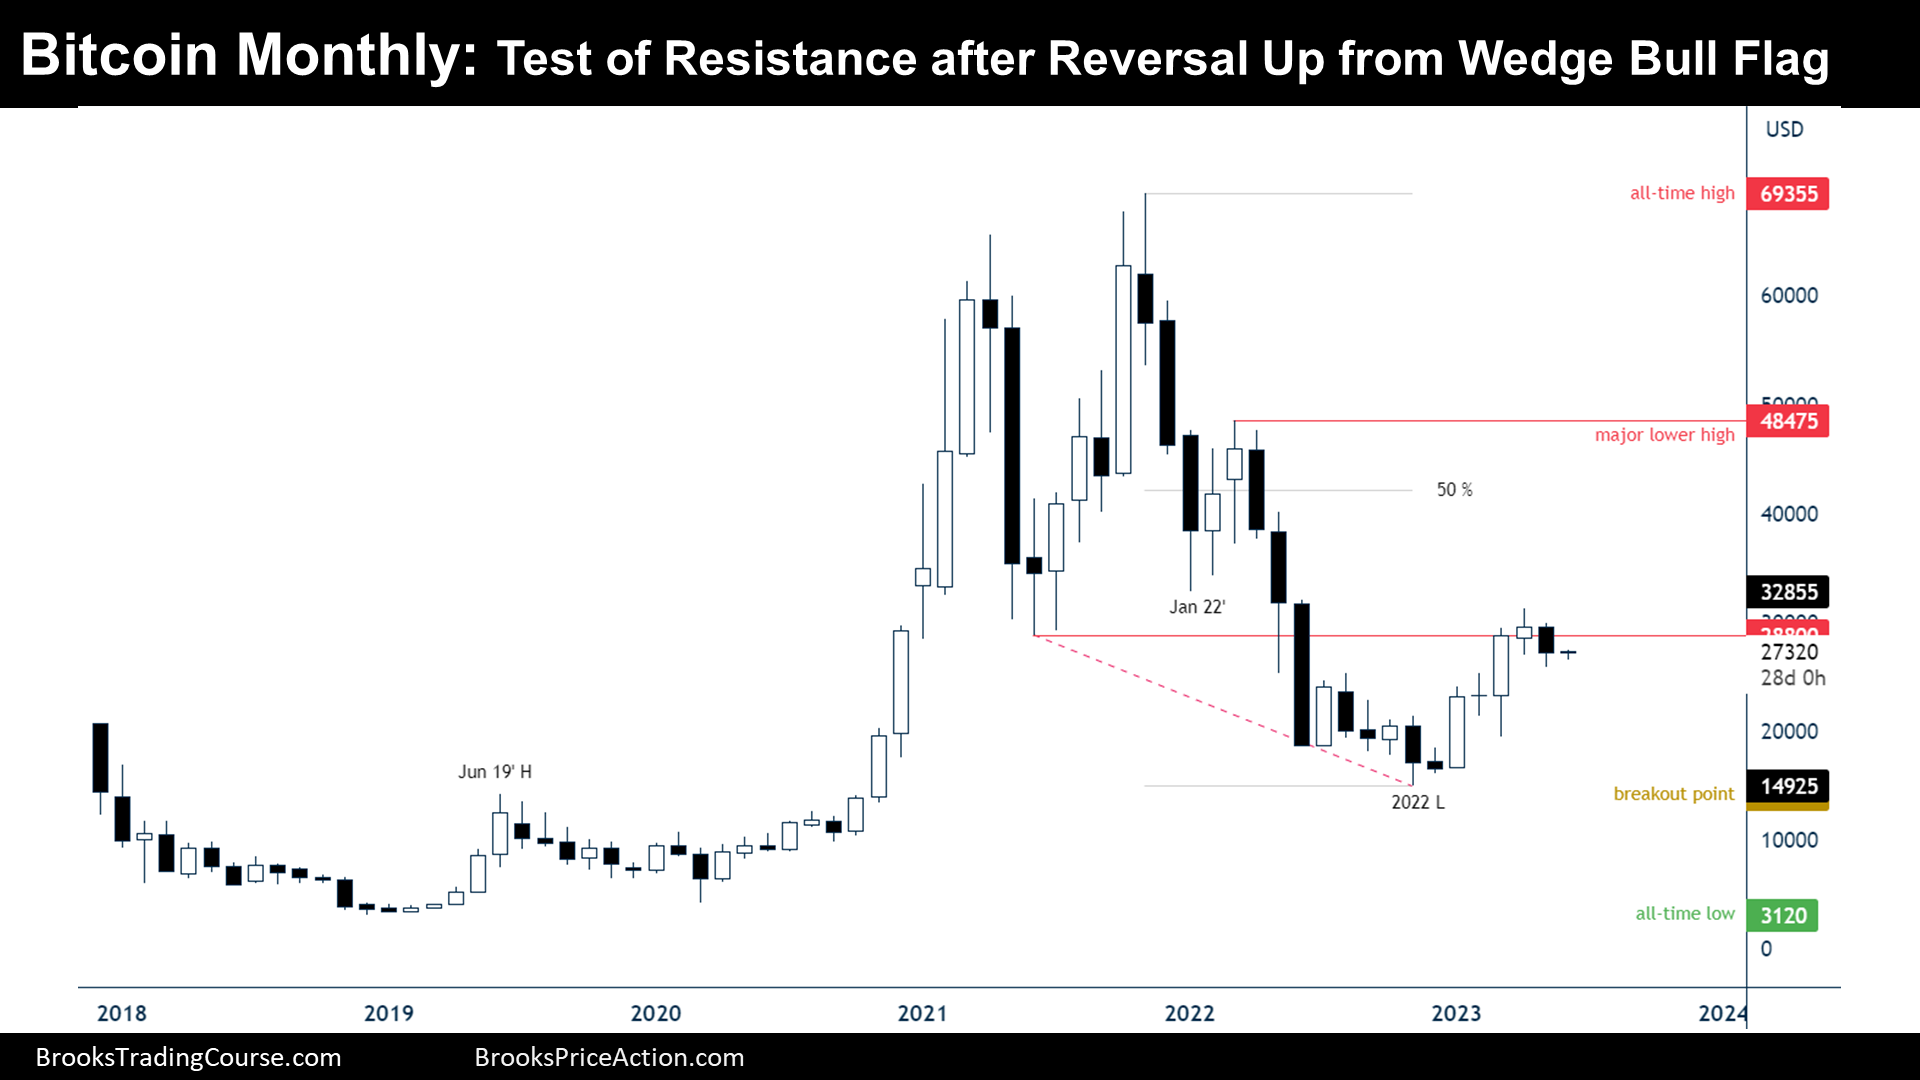
Bitcoin reversal down attempt from a monthly chart resistance. During May, the price decreased its value by 7.89%. At the end of the first quarter of the current year (Q1) we have said that the closing price in March could be the most important price during the Q2; so far, the price is gravitating around there since then. The monthly chart of Bitcoin entered within a buy zone in 2022, when it traded below the June 2021 low; by the end of that year, a wedge bottom pattern was created, and the monthly chart price action for 2023 is a reversal up from a wedge bull flag within a buy zone. Nowadays, the price is attempting to reverse down from a resistance formed by a prior major higher low, and it will likely go sideways to down for a while before resuming the reversal up.
Bitcoin futures
The Monthly chart of Bitcoin futures

Analysis
- May’s candlestick is a bear bar with a prominent tail below. It closed below the monthly resistance formed by a previous major higher low, the June 2021 low.
- Bitcoin is reversing up from a wedge bottom that was formed within a buy zone.
- Now, why that is a buy zone?
- The price did a (strong) breakout (late 2020 until early 2021) surging from a trading range (between late 2017 and late 2020).
- The market cycle theory says that after a breakout comes a channel in the direction of the breakout, and hence, traders expect a retracement.
- If the breakout does not come out from a trading range, it won’t probably be followed by a channel in the direction of the breakout. It will likely just be a leg within a trading range, and traders will expect a reversal.
- Since the Bitcoin breakout was coming out of a trading range, the whole drawdown from the all-time highs is being viewed like a retracement.
- But the June 2021 low is a resistance, and normally, the price will start a minor reversal down when facing a resistance based upon the previous breakout point formed by a prior major higher low that has been broken.
- Bulls:
- The bulls want June to do not trade below the May and create a bull bar. That will be viewed as bullish and may be the resumption of the reversal up.
- They think, reasonably, that the price is more likely to get to the major lower high instead than below the 2022 low.
- Their scenario will be invalidated only if the price gets below the last bull bar of 2020 at $10410.
- Bears:
- They want June to trade below May, since that might prevent bullishness during the start of Q3.
- The market cycle theory does not favor them (a full reversal), I think it is a mistake for them to sell around the current resistance, betting to get to the $10410 level.
- The selling pressure will probably come from trapped longs that were buying all the way down during the drawdown from all-time highs.
- They will have better chances of a swing down if the price gets to the major lower high with signs of weakness.
Trading
- Swing Bulls:
- May is not a good buy signal bar. But bulls can buy reasonably around here, with a stop loss below the 2022 low, first target around being between the major lower high and $60000. It is a trade that might take 2 years to pay out.
- Swing Bears:
- I am not convinced that swing bears should sell around this area, in this timeframe.
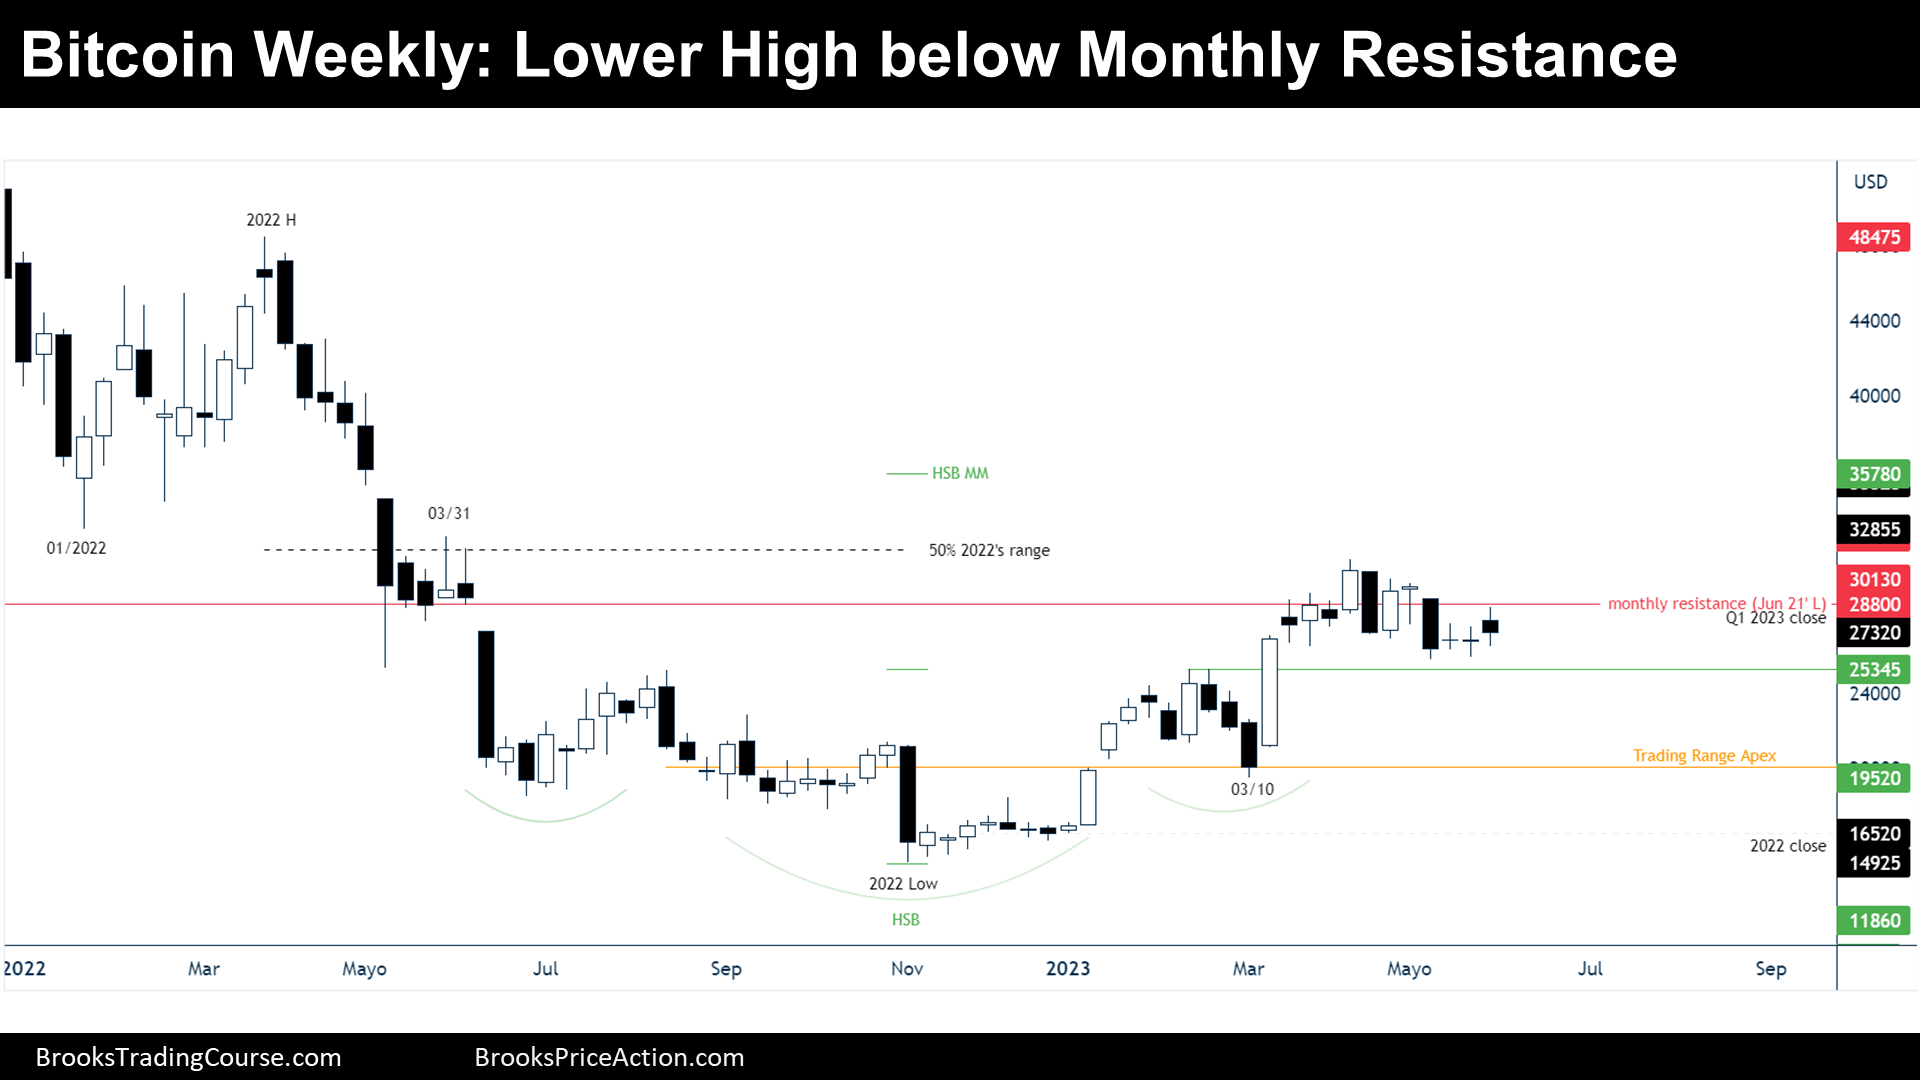
The Weekly chart of Bitcoin futures

Analysis
- This week’s candlestick is a bear bar with a small body. The price tested the Q1 2023 close and the June 2021 low and then reversed down.
- The prior two weeks we had dojis. This week we had a small body. Normally, dojis and small bodies precede explosive moves in one direction or the other.
- Since we are at resistance and at the beginning of a month, we should expect a wide range bar happening within the next 1–3 weeks.
- The bears might have the odds on their side, since the price is failing to get closes above the monthly resistance.
- If I were a bull, I would love to buy a reversal up from the Apex of the head and shoulders bottom (HSB). The breakout above the HSB has been weak.
- Furthermore, that kind of move down would trap retail bears into shorts, while stopping out retail bulls who will have their stop loss below the March 10th major higher low. That would be an ideal scenario for a strong move towards the 2022 high.
- However, for the moment, the price even did not close the gap between the price and the HSB breakout point; thus, bulls have their reasonable chances of getting a new 2023 high or even get to the HSB measured move (MM).
- Bulls:
- If they want to get to the 2022 high they might need fuel (liquidity) and hence, a move down to the major lower high won’t invalidate their bull thesis.
- If they achieve fresh highs without reversing down further, traders will see a wedge top formation and around a 50% retracement of 2022’s range, or the HSB MM, the price will probably start a two legged down move towards the March 10th low.
- Bears:
- A reversal down from the monthly resistance might be underway, but their potential run is limited.
- They will likely look to sell if there are fresh highs soon, but for that, they would prefer first a close of the gap between the price and the HSB breakout point. That will give them more confidence to sell above 2022 highs.
- There might be a wide range bar next week, and since this week was a bear bar, and the price reversed down from a test of resistance, bears have more chances of that happening.
Trading
- Swing Bulls:
- This week’s candlestick, it is not a good buy signal bar.
- If the next week the price does not go above the current week’s high, and then the price breaks above it and get a bull bar close, that might anticipate a 1-3 bar upside move.
- Most should wait for other patterns to unfold, or wait until there is a double bottom around the March 10th. That would be my personal choice.
- Swing Bears:
- This week’s candlestick, is not the best sell signal bar, but the context might be good enough for the bears to look to sell below the current bar, with a stop above this week’s bar, and targeting the March 10th low.
- It is not a trade that I would take on this timeframe, but I think that the math is ok. However, I might go to lower timeframes and try to find a greater probability, risk, and reward equation, with this idea in mind.
Market analysis reports archive
You can access all weekend reports on the Market Analysis page.


I have another question:
Is it possible this move to 30k is a test of the May 10, 2022 week price range?
Josep,
Thanks again for your analysis, once again it has been a very interesting read. I have some questions, if you don’t mind:
“Since the Bitcoin breakout was coming out of a trading range, the whole drawdown from the all-time highs is being viewed like a retracement.”
-This is a retracement into the previous trading range? Is the channel in the direction of the breakout still valid?
“They think, reasonably, that the price is more likely to get to the major lower high instead than below the 2022 low.”
-The resistance of the June 2021 seems to be significant. Is there a way to calculate the strength of these trapped bulls?
-Can this be done with volume?
-Why do you feel it is more likely price will break this resistance than reverse down to support lower in the trading range?
“I am not convinced that swing bears should sell around this area, in this timeframe.”
-May I ask why you are not convinced?
“If they want to get to the 2022 high they might need fuel (liquidity) and hence, a move down to the major lower high won’t invalidate their bull thesis.”
-How do you observe this liquidity?
I hope I am not bothering you too much with my questions. I truly enjoy that your analysis challenge my understanding of price action trading.
Thanks,
Elijah
Hola Elijah! Thank you for your read and nice comments, I am pleased to try to answer your good questions!
A: This is a retracement into the previous trading range? Is the channel in the direction of the breakout still valid?
Q: A retracement after a breakout can retrace until previous breakout points, or even until the apex of the previous trading range. The problem here, is that the apex of the 2017-2020 is at $12000 and hence, very close to the $10000 that would invalidate the bull thesis, since trade at around $10000 will mean a full reversal of the whole breakout.
I think that until there is not a full reversal, the channel in the direction of the breakout is the scenario that should be played.
A: The resistance of the June 2021 seems to be significant. Is there a way to calculate the strength of these trapped bulls? Can this be done with volume? Why do you feel it is more likely price will break this resistance than reverse down to support lower in the trading range?
Q: I do not utilize anything outside from price action and do not really know much about it; I know that there are good price action traders out there that utilize the commercial banks positioning (through Commitment of Traders Report) to strength their long-term thesis.
A: -May I ask why you are not convinced of selling around this area?
Q: Because I think this is a buy zone, and hence, the equation between probability, risk and reward, is bad. Of course, it might react there, but I think that traders should go to lower timeframes in search of better math (a proper market cycle).
A: How do you observe this liquidity?
Q:
– Trading Range, the liquidity is at the Apex of the trading range.
– Broad Channels, at major highs and lows.
– Breakout, at the major breakout point.
– Small Pullback Trend, at the open gaps (3 bars and no overlap in between, see example in form of blue shades of daily chart of Timothy’s following report https://www.brookstradingcourse.com/analysis/dax-40-all-time-high ).
If the Monthly chart had a breakout, the liquidity would be at prior breakout points: all-time high (2017 high) or the 2019 high.
If the Weekly chart is within a Broad Bull Channel, liquidity is at the March 10th major higher low.
But if the weekly is a breakout of a HSB, the liquidity is at the HSB breakout point. Nowadays, and after so much sideways trading after the HSB breakout, I doubt that this is likely.
I hope that this answer helps, and please, do not hesitate to ask anything, it is always a pleasure to answer anyone’s good question or comments.
Josep.