Market Overview: Bitcoin
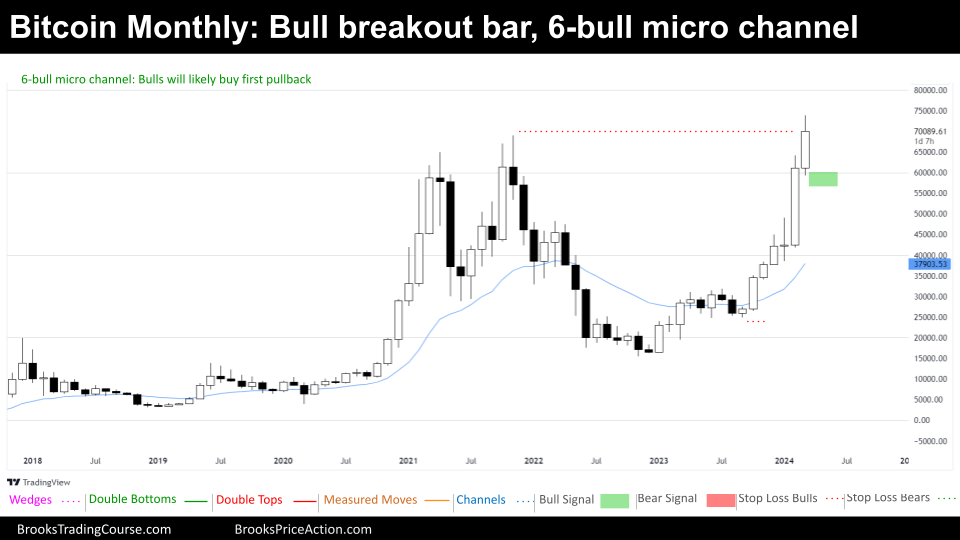
Bitcoin experienced a significant surge in February, demonstrating a strong bullish breakout on the monthly chart. However, this price movement remained within a previously established range. March brought even more excitement, with Bitcoin reaching a new all-time high of $73,835. The month’s candlestick looks set to close above 2021’s peak.
While this new high is noteworthy, the preceding 6-bull micro channel holds more weight. Moreover, there’s the possibility of a double top pattern forming with the previous all-time high, which needs close observation.
Special: The Bitcoin halving
The next Bitcoin halving will occur during the upcoming month, April. A halving is a pre-programmed event designed to control the supply. Approximately every four years, the reward for miners who verify Bitcoin transactions is cut in half. This reduction in new Bitcoin entering circulation creates scarcity, which is believed that has had a positive impact on its price historically. However, when something is certain in the markets, it is probably already priced in.
Bitcoin
The prices depicted on our charts are sourced from Coinbase’s Exchange Spot Price. It’s crucial to note that the spot price of Bitcoin is continuously in motion; trading activity never ceases. This means that market fluctuations and price changes occur around the clock, reflecting the dynamic nature of cryptocurrency trading.
The 3-month chart of Bitcoin

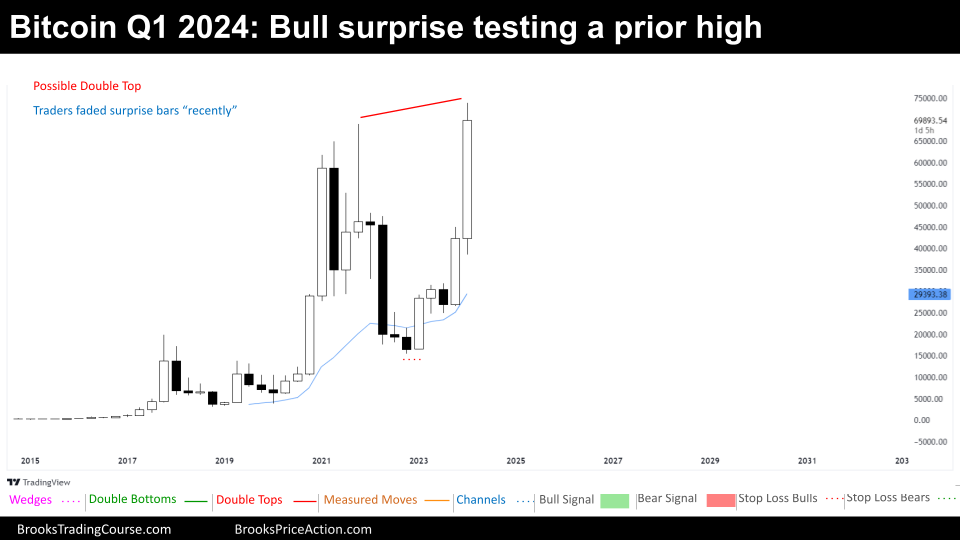
Bitcoin’s price action throughout 2020 and 2021 was dramatic, with a powerful surge followed by a sharp 80% decline. However, a remarkable recovery took place between early 2023 and the first quarter of 2024, propelling Bitcoin to a new all-time high.
The 3-month chart suggests an always in long market. Yet, the recent market cycle appears more like a trading range than a sustained bull breakout, primarily due to the strong bearish leg directly preceding it. While a potential spike and channel bull trend might form, it remains too premature to confirm.
Currently, the possibility of sideways or downward movement looms, potentially stemming from a double top pattern forming near the 2021 high or the previous all-time high. Despite this, the bulls have displayed unexpected strength. Following such high volatility, a contraction pattern with tighter ranges or a triangle formation is common before significant moves occur.
Buying at the current all-time high presents a challenge, as many bulls are likely taking profits. Many traders might choose to fade this move, potentially placing initial stop-losses at a measured distance from the 2021 high to 2022 low range. They will likely exit their positions if Q2 of 2024 demonstrates a strong follow-through to the bullish breakout. Traders fading the trend could target profits of a $10,000 or $20,000 downward move.
The Monthly chart of Bitcoin

Bitcoin’s monthly chart reveals an always in long market that has experienced a significant bull breakout market cycle. This breakout has propelled the price to a new all-time high, though its sustainability remains uncertain. March’s candlestick exhibits a prominent upper tail, potentially hinting at early signs of weakness.
Throughout the bull breakout, buying the close has been challenging due to multiple resistances, including a major lower high, a 50% retracement, and sell zones. Bulls should approach buying the close at this major resistance level with caution.
The initial bear reversal after such a breakout could potentially fail. Opportunities for favorable trades may arise by buying below the latest bar after a 6-bar micro channel formation, or buying after a strong bear bar close. Purchasing pullbacks appears to be a more prudent strategy at the current price level. Traders expect, at least, another leg sideways to up.
Bears who sold above the all-time high have already profited from a considerable scalp-sized move ($5,000 to $10,000), as visible on the weekly or daily charts. When Bears start to make money, Bull trends weaken.
The Weekly chart of Bitcoin

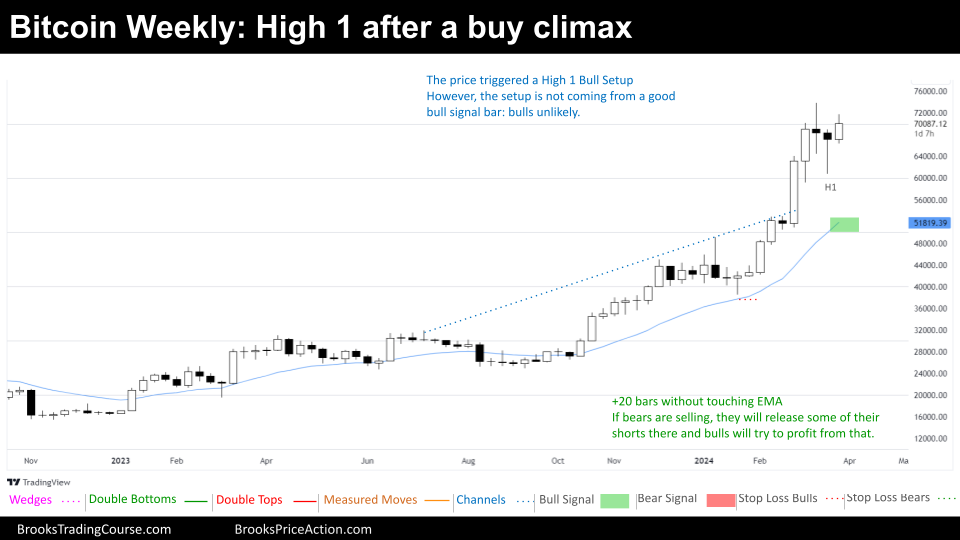
The market maintains its always in long structure and is currently exhibiting a Tight Bull Channel market cycle after a recent pullback. While a late bull breakout within a long-lasting bull channel often signals a buy climax test of resistance, bullish trading strategies have a higher success rate in this market environment.
Bulls who bought below the first of the bull breakout of the bull channel, have earned scalp-sized profits. Those buying above a High 1 may still see gains, but the High 1’s small bear body suggests it’s not a particularly strong bullish signal.
Typically, bulls find profitable buying on the first strong bear bar that follows a robust bull breakout or tight bull channel. They anticipate further gains even with a deeper pullback, given the presence of the 20-week exponential moving average (20-week EMA). Traders are conditioned to buy after 20+ bars above the moving average. In the event of a pullback, they expect a retest of the highs rather than a direct move toward the major higher low below $40,000.
The Daily chart of Bitcoin

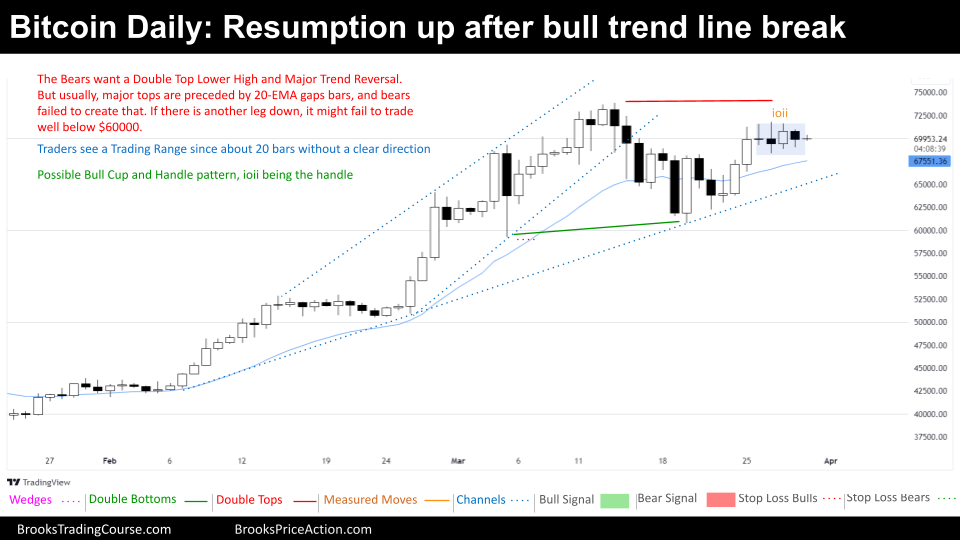
The daily chart presents a less decisive picture, without a clear “always in long” or “always in short” bias. The market has been trading sideways for the past 20 bars, following a previously strong bullish trend. And as commented, the recent action broke the steeper bull channel’s lower trend line.
This break in the bull trend line prompts bears to keep an eye out for a potential Major Trend Reversal setup. Another factor worth noting is the upward resumption of price movement after the bull trend line break. Despite this, bears have failed to create a gap bar below the 20-day EMA, which often precedes a significant top.
Given the prevailing bullish trend and the price still residing within a broader bull channel, bears likely need stronger confirmation before initiating short positions. This could manifest as consecutive bear closes, a clear “always in short” pattern, or some form of unexpected bearish event.
For bulls, buying at the higher end of a 20-bar trading range is a risky proposition. They might choose to wait for another bearish attempt before entering long positions, or watch for a clear shift back to an “always in long” structure.
Thank you for reading this week’s market analysis! We hope you found the insights into the Bitcoin charts helpful. Please have no hesitation to leave comments below with your thoughts, questions, or any particular areas you’d like to see explored in future reports. Your participation makes this analysis even more valuable!
Market analysis reports archive
You can access all the weekend reports on the Market Analysis page.


Josep hey,
Thanks for another great report!
I couldn’t agree more with your PA analysis.
Adding the fact that on HTF, Quarterly and Monthly in particular, close of bars are above ATH and if you compare close to close thus, we are 20% and more up vs last OTHC – wondering what is your observation on that?
Question: do you agree for a potential wedge top that have started with December 2017 high, trough 2021 high area and this quarter/month high?
Hi!! thank you very much for your comment and your questions! I agree that bullish momentum in Bitcoin is undeniably strong, and your point about higher timeframes being bullish is noteworthy. Here’s a breakdown of your wedge top question and some additional insights:
While a wedge top pattern could be forming since the December 2017 high, its truncated nature makes it less reliable for pattern-recognition algorithms. Regardless of the technical pattern, significant sell-offs after new highs are a common dynamic, which is precisely the case after wedge tops. Expecting you on the new report!
Have a lovely weekend.