Market Overview: Bitcoin
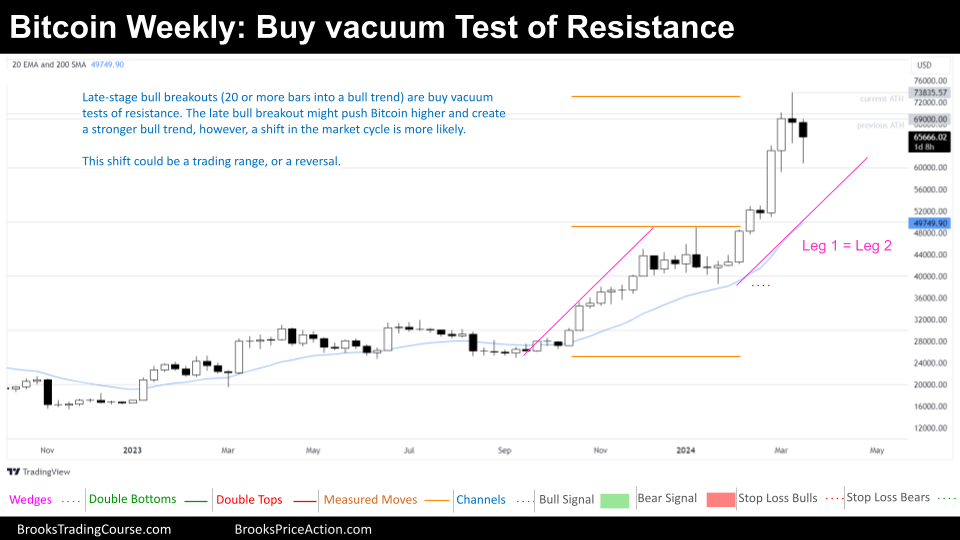
Bitcoin faces a potential trend reversal after failing to sustain momentum above its previous all-time high. This week’s price action dipped below the prior low, snapping a seven-week winning streak on the weekly chart. Our previous analysis anticipated aggressive bears selling a doji bar after a buy vacuum test of resistance, and this played out as expected. Will the price continue its downward trajectory until the buy climax low, or can bulls regain control?
Bitcoin
The prices depicted on our charts are sourced from Coinbase’s Exchange Spot Price. It’s crucial to note that the spot price of Bitcoin is continuously in motion; trading activity never ceases. This means that market fluctuations and price changes occur around the clock, reflecting the dynamic nature of cryptocurrency trading.
The Weekly chart of Bitcoin

The Always in Long weekly chart suggests a fundamental bias for appreciation, but the situation demands closer scrutiny.
The recent bull breakout, technically a positive move, occurs within a larger, established bull channel. This late-stage breakout within a bull channel can often be a signal that the overall trend is reaching maturity and could be susceptible to a reversal. As we discussed last week, these breakouts can function as buy vacuum tests of resistance, attracting new buyers before a potential reversal.
Therefore, while the breakout itself is bullish, the context proposes a higher likelihood of a transition into a trading range rather than an immediate continuation of the strong uptrend. This is further reinforced by the recent price reversal after reaching a major resistance level.
A bullish perspective might interpret the recent price action as a healthy pullback within a tight bull channel. This view would suggest buying opportunities below the prior bar. However, ignoring the broader context of the late-stage bull breakout and the major resistance level reached would be a risky move.
This week, a technical buy signal emerged as the price dipped below the prior week’s low after a 7-week bull micro channel. However, this signal is overshadowed by the larger concerns surrounding the bull channel’s maturity and the recent reversal at a major resistance.
Bulls remain optimistic and will likely continue buying on strong setups like a High 2 or High 3 reversal pattern if bears fail to gain momentum in the coming weeks. These patterns indicate a potential resumption of the uptrend despite the recent pullback.
While bears haven’t established a strong presence yet, their initial success in pushing the price lower suggests they may continue to exert pressure in the following weeks.
This week’s chart analysis presents conflicting signals for both bulls and bears. Traders are wise to adopt a wait-and-see approach, closely monitoring future price action and confirmation signals for either a continuation of the uptrend or a transition into a trading range.
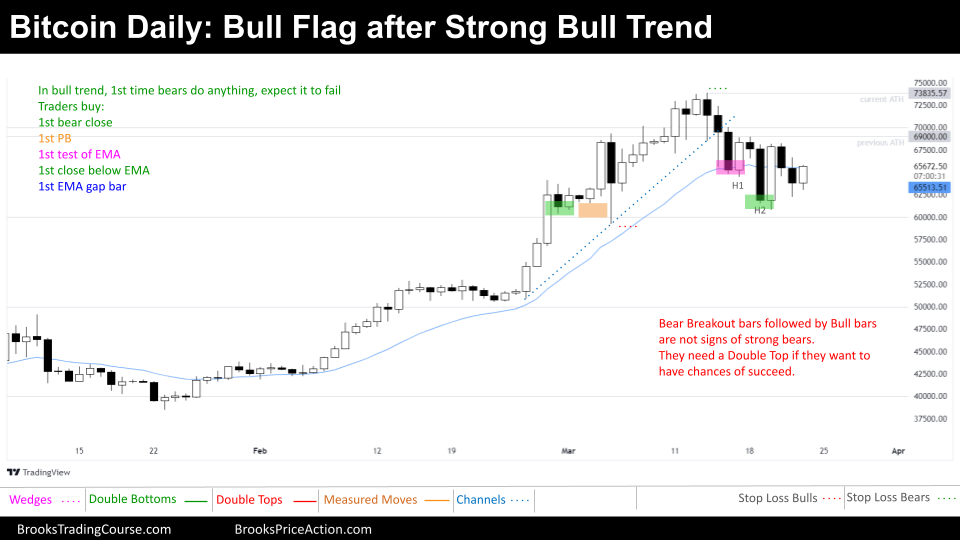
The Daily chart of Bitcoin

The daily Bitcoin chart presents a tug-of-war between bulls and bears, lacking the clear Always in Long or Always in Short direction. This follows a strong bull trend that culminated in a parabolic wedge top, leading to the current pullback.
The prevailing interpretation among traders is that the price action is currently forming a bullish flag pattern. This pattern proposes a potential resumption of the uptrend after a healthy consolidation. However, it’s crucial to acknowledge the broader context.
While bulls have successfully defended previous bearish attempts since the breakout above $50,000, their recent efforts haven’t been as fruitful. A promising High 1 setup failed to materialize, as it is anticipated after a period of overbought (parabolic wedge top late in bull channel) conditions. While a High 2 offered a better chance for a reversal, it unfortunately triggered above a strong bear breakout bar.
Bulls are now pinning their hopes on a successful High 3 pattern with a bull body. Additionally, they’re eyeing an opportunistic entry point at the first gap that forms below the 20-day exponential moving average (EMA). Considering the price stalling at resistance, these trades might be better suited for quick profits, at least partials may be taken.
Bulls are placing their stop losses below the major higher low around $60,000. If a gap below the 20-period EMA forms below this level, the stop loss might be adjusted to the prior major higher low that is right above $50,000.
The future trajectory hinges on how the price reacts at the current level. If the bulls can muster the strength to retest the all-time high, it could signal a major trend reversal attempt. However, if the price continues to drop without attempting a retest, it could morph into a V-shaped top, a notoriously difficult pattern to profit from.
The current price action lacks a definitive Always in Long or Always in Short signal, suggesting a potential range-bound period with reversal opportunities even if clear direction at some point, due to the presence of a price range on the left side of the chart further reinforces this notion.
That’s all for this week’s Bitcoin analysis! As always, the market presents a complex puzzle. We hope this breakdown provided valuable insights for your trading decisions.
Remember, your participation is what fuels this blog! Feel free to share your thoughts, questions, and alternative analyses in the comments below. Let’s keep the conversation going and help each other navigate the ever-evolving Bitcoin landscape. Additionally, if you found this content helpful, consider sharing it with your fellow traders to spread the knowledge!
We look forward to delving back into the charts with you all next week. Until then, happy trading!
Josep Capo
Market analysis reports archive
You can access all the weekend reports on the Market Analysis page.


Thanks Josep for your detailed report. Don’t know which data you are using but it seems this week despite being bear bar closes above November 2021 close (ATHC), so if I’m right wondering what is your interpretation re potential BO above November 2021close?
Thanks Eli, appreciate you pointing that out! My data is from the Bitcoin Spot Price on Coinbase Exchange. It shows the highest weekly close in 2021 was $65505, so we’re very close. There’s still 12 hours left in the weekly bar to close, so the final picture could change, currently almost there at $65463.
On your question about a potential breakout above the November 2021 close, here’s my take:
We should be looking at the monthly chart. While there might be short-term profit opportunities for buying here, it comes with risk because bulls have their stops far away. For bears, low probability but better risk reward ratio. Also, quick trades.
For a more established swing trade setup, I’d prefer to see:
Some sideways price movement, potentially a bullish continuation pattern like a Cup and Handle.
A confirmed breakout above that pattern before entering a long position.
This would offer an idyllic trader’s equation for bulls.
Presently, buying or selling for a swing trade feels risky.
Buying a rising price is difficult because we’re far from the EMA (Exponential Moving Average) and the last major low, making stop-loss placement tricky.
On your reasoning, I’d love to hear your thoughts as well!
What factors are leading you to consider a potential breakout despite the climatic behave of the price and posterior reaction at the previous ATH?
Thanks Josep for your clarifications.
I anticipate a potential BO in particular due to the monthly chart behavior.
a. There is a HSB pattern composed from November 22 low (Head), March 22 & January 24 (Shoulders) that should take us toward the 80k area. Feb bullish bar have confirmed the HSB BO and yet to see how March will be close.
b. The current month is a BO above ATHC but currently a shallow one yet to be seen how the month will be close.
None PA arguments is the halving stage we are about to face and tones of Money that have been placed into the new approved and regulated ETF’s
I fully agree PA behave is claimatic.
Thank you for your detailed analysis! Your perspective on the bullish momentum and the potential impact of ETFs and the halving is definitely interesting.
While I don’t see the same HSB pattern as you outlined, I certainly see nested cup and handle formations, that are the same, reversal up patterns, and one align exactly with what you see. It’ll be interesting to see how these patterns resolve. Would you be willing to share a chart highlighting the HSB pattern you see?
I agree that the current bull breakout is significant, but it’s important to be cautious, as you’ve pointed out. Would you mind elaborating on the specific factors that lead you to expect further upside in light of the potential risks (difficult to frame a trade for monthly and weekly bulls since stop is far away)? I’m sure others in the community would also benefit from your insights.
We are always looking to enhance our analysis, and your contributions are genuinely helpful. Let’s keep this discussion going and see how these patterns play out!
Josep hey, those are my arguments (MONTHLY CHART):
1. As of 08/23 we are on tight bull channel – 7 bars in row.
2. Beside January 2024 that was a TR bar and also the right shoulder with March 2022 high as the left one, all bars are closes @ the top of the bar with minor tail above.
3. The bottom of the bars with extremely minor tail which means bulls are in control from the very open of the month till it closes.
4. As of September 2023, every bar is a gap bar (Body and bottom vs top).
5. Every high is above the previous high.
6. Ever close is above the previous close.
7 If you draw trend line from March 2020 and November 2022 whereby the parallel channel line is at the top of November 2021, you will notice that the channel is being respected with a room up to 80k that is also the HSB MM target.
All of the above cause me to assume that if a PB will occur 2nd leg sideway to up is more likely.
On the downside:
1. We are far from 20ema
2. We are close to the trend channel line from the top.
3. It seems we are forming sort of parabolic wedge
Regarding the stop you don’t have to go to the extreme with such climatic behave and place the stop at the very recent HL. A stop below this month low assuming it close at least as it is now or below February low can also work.
Thanks for the detailed analysis. You make excellent and helpful points for each of us!
Regarding your stop-loss suggestion, I have a slightly different take, since I do not believe that that has a positive trader’s equation.
I would argue that the proper reference point is the major higher low, or even the lower low (these would be, to me, logical or technical risk references), since there are probably buyers (both bulls and bears buying) starting around the 50% mark, which is around the suggested stop loss.
What I would do in cases where I want to buy but the logical/technical risk is not attractive, is to use a higher timeframe, assess the market again, and if I want to buy and if the trader’s equation is attractive, I would buy and use the stop and profit targets based upon that timeframe.
Let me know your thoughts on this!
Josep
Agree Josep that trader equation at this PA structure is not optimize.
If I want to enter the market with the assumption of potential BO or 2nd leg up, best way would be to start with 25%-30% position and scale in as long as we see bulls buying such as H1/2/3…n. This will allow to accept the stop you suggest and participate. If you are wrong thus you could exit based upon stop placed or even earlier. By saying higher TF do you refer to quarterly?