Market Overview: Bitcoin Futures
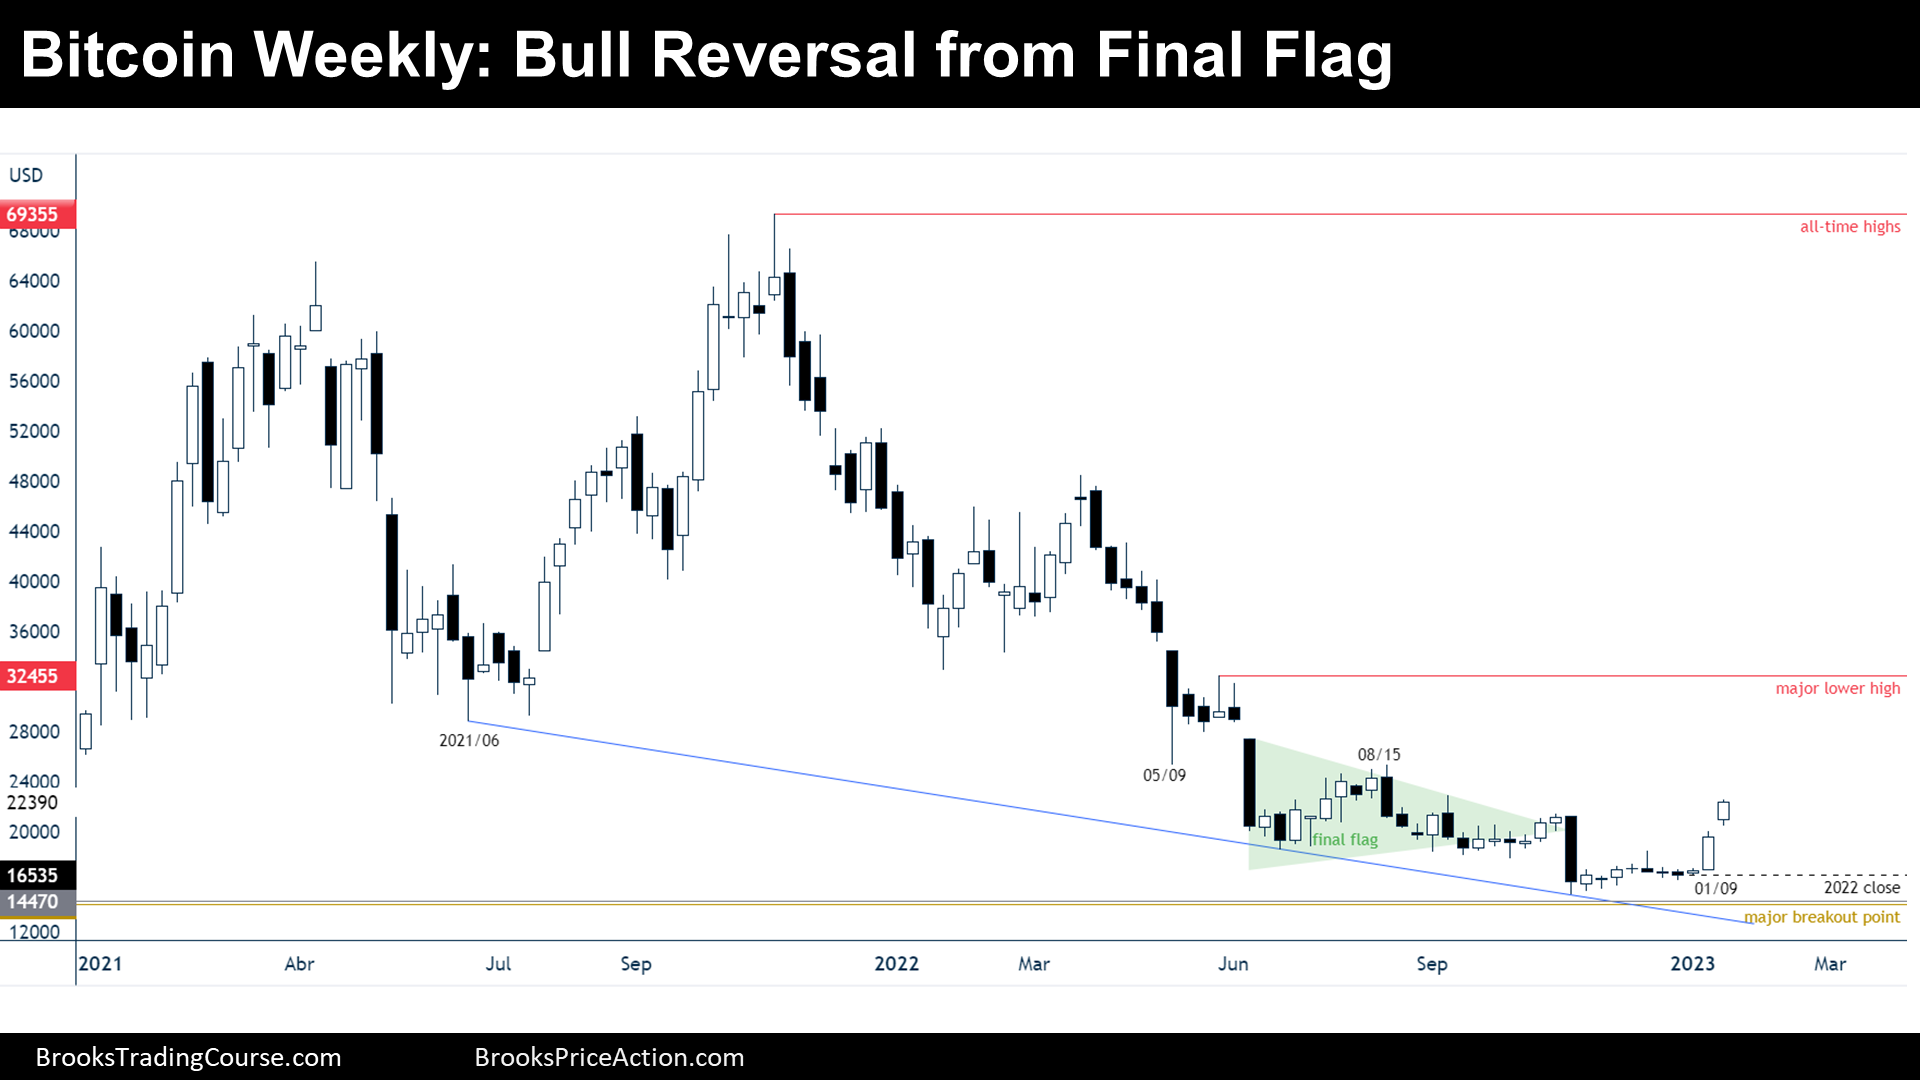
Bitcoin futures are reversing up from a final flag pattern, a Bitcoin bull reversal. During the week, the price increased +14.53% of its value. The current rally is the biggest one since 2021.
Bitcoin futures
The Weekly chart of Bitcoin futures

Analysis
- This weekly candlestick is a bull breakout bar closing near its high. It is a good follow through bar for past week’s final flag bull setup.
- There is a gap between the low of the current week and the high of the past week. The bulls bought the bull setup even with a big gap up.
- I have been saying since June 2022 that the market cycle is more likely a trading range than a bear trend; furthermore, I have said that in trading ranges, after a bear leg we should expect a bull leg. Now, there are two strong consecutive bull bars: the bull leg is probably underway.
- The resistances above the current price are forceful because some gaps suggest that there are trapped bulls:
- There is a gap between the August 15th high and May 9th low. There, there is also the $25000 big round number.
- June 2021 low.
- Nowadays, the price is either:
- Bull case: A bull leg in a trading range is underway. The principal target for the bulls is to end the bear inertia before there is a new low. Technically, if the bulls get to the prior major lower high at $32455, the bear trend will be over. Trading around $30000 will mean that bulls buying and scaling in lower are making money, so they buy again below fresh lows.
- Bear case: The bears want the bull leg to fail, they want to close the gap between this week’s low and past week’s high.
- There are two consecutive bull bars and open gaps, the bull momentum is strong and there might be at least another bull bar before there is a pullback.
Trading
- Bulls: Current bar is a good buy signal bar. The probability favors higher prices during the upcoming weeks. The bulls might take quick profits because the past bear leg was strong enough to expect another leg sideways to down at some point.
- Bears: It might be intelligent to look to sell around the price levels mentioned above where there are trapped bulls that will add selling pressure, thus, increase their odds of making money. $25000 and $30000 areas might be sweet spots for sellers.
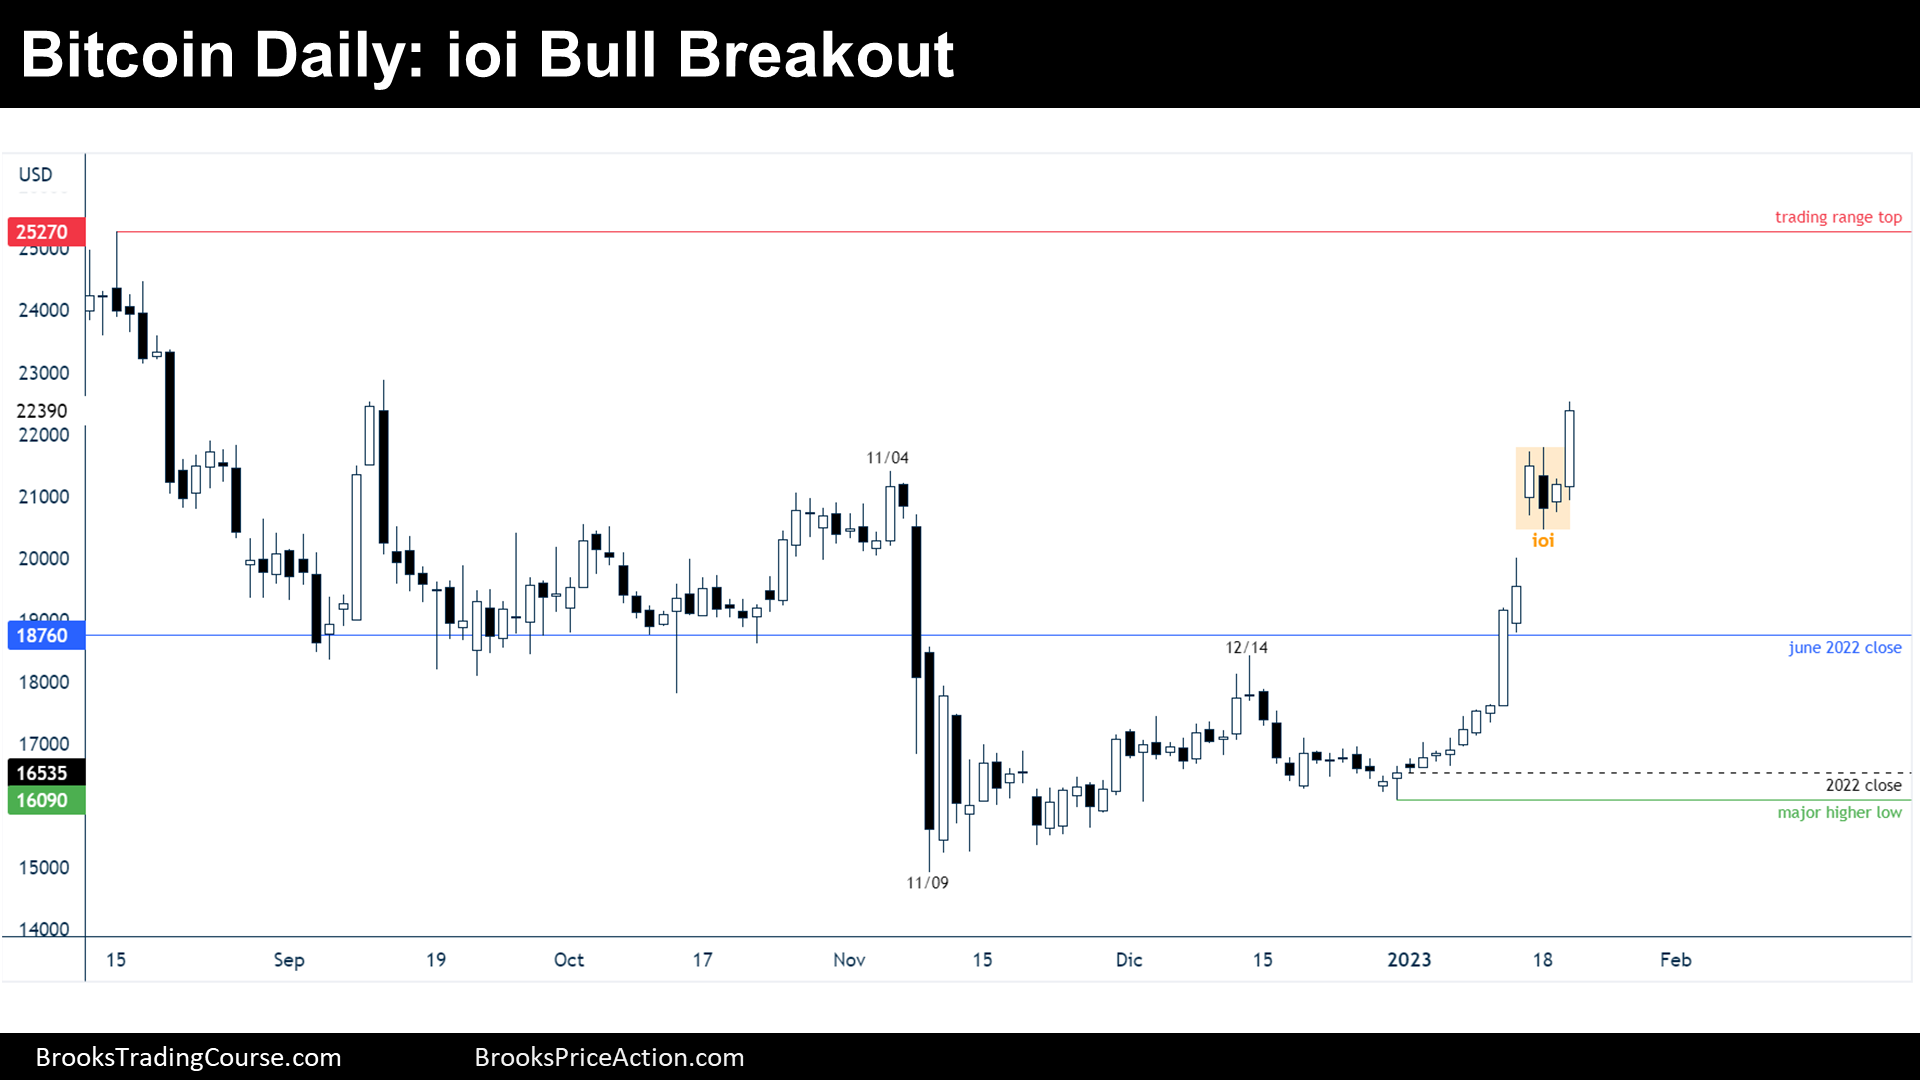
The Daily chart of Bitcoin futures

Analysis
- During the past report, I have said that traders should expect a pullback before Wednesday, and this is what happened.
- After the retracement on Tuesday, the price formed an ioi pattern, which is a flag. That was both a bull and a sell setup. I have mentioned on the past report that bears were willing to sell such kind of pattern for a failed breakout in a trading range. But the pattern triggered to the bull side strongly.
- The ioi may be revisited soon into the future because the breakout is climatic.
- The bulls ended, technically, the broad bear trend market cycle by trading above the November 4th high.
- There is the strong resistance of the 200-day moving average (not shown in the chart) right above the current price that might act as a magnet at $23257. It might be tested before there is a retracement.
- The price reached all measured moves based on the prior range. The ioi pattern is evidence of signs of partial profit taking.
- This current bull leg has been strong enough to expect, at least, another leg sideways to up, or even 3 legs up.
- Even if this bull breakout has been strong, there is a trading range on the left of the chart; thus, an area of agreement. The June 2022 close will likely be tested at some point in the future.
- Nowadays, the price is either:
- Bull case: This is the start of a bull trend, a spike and channel type.
- Bear case: This is just a bull leg in a trading range and at some point, after a bull leg, there will come a bear leg.
- The bulls are strong and the price it is likely to continue up, but traders should expect a couple of legs sideways to down starting during the following weeks.
Trading
- Bulls: The up move has been fast and strong, by now, it is hard to start buying. The bulls might prefer to buy a pullback or wait to check strength during a couple of down legs.
- Bears: It is ok for them to look for Low 2 sell setups or reversal patterns like, for example, an ii.
Market analysis reports archive
You can access all weekend reports on the Market Analysis page.


Thanks Josep for great analysis. I see correlation to BTC PA behave vs S&P-500. If S&P will break its bear trend line started by 2022 beginning thus your analysis of BTC making 2nd and even 3rd leg up will probably occur.
Hola Eli! Thank you very much for this comment and the great insights that you shared!
Wishing you a great start of the week.
Josep