Market Overview: Bitcoin Futures
Bitcoin futures broke up above the major bear trend line by trading sideways, which should be viewed as a significant loss of strength from bears. Bulls are not looking strong, but if bears exit their shorts, the price will go up during the rest of the year.
Bitcoin futures
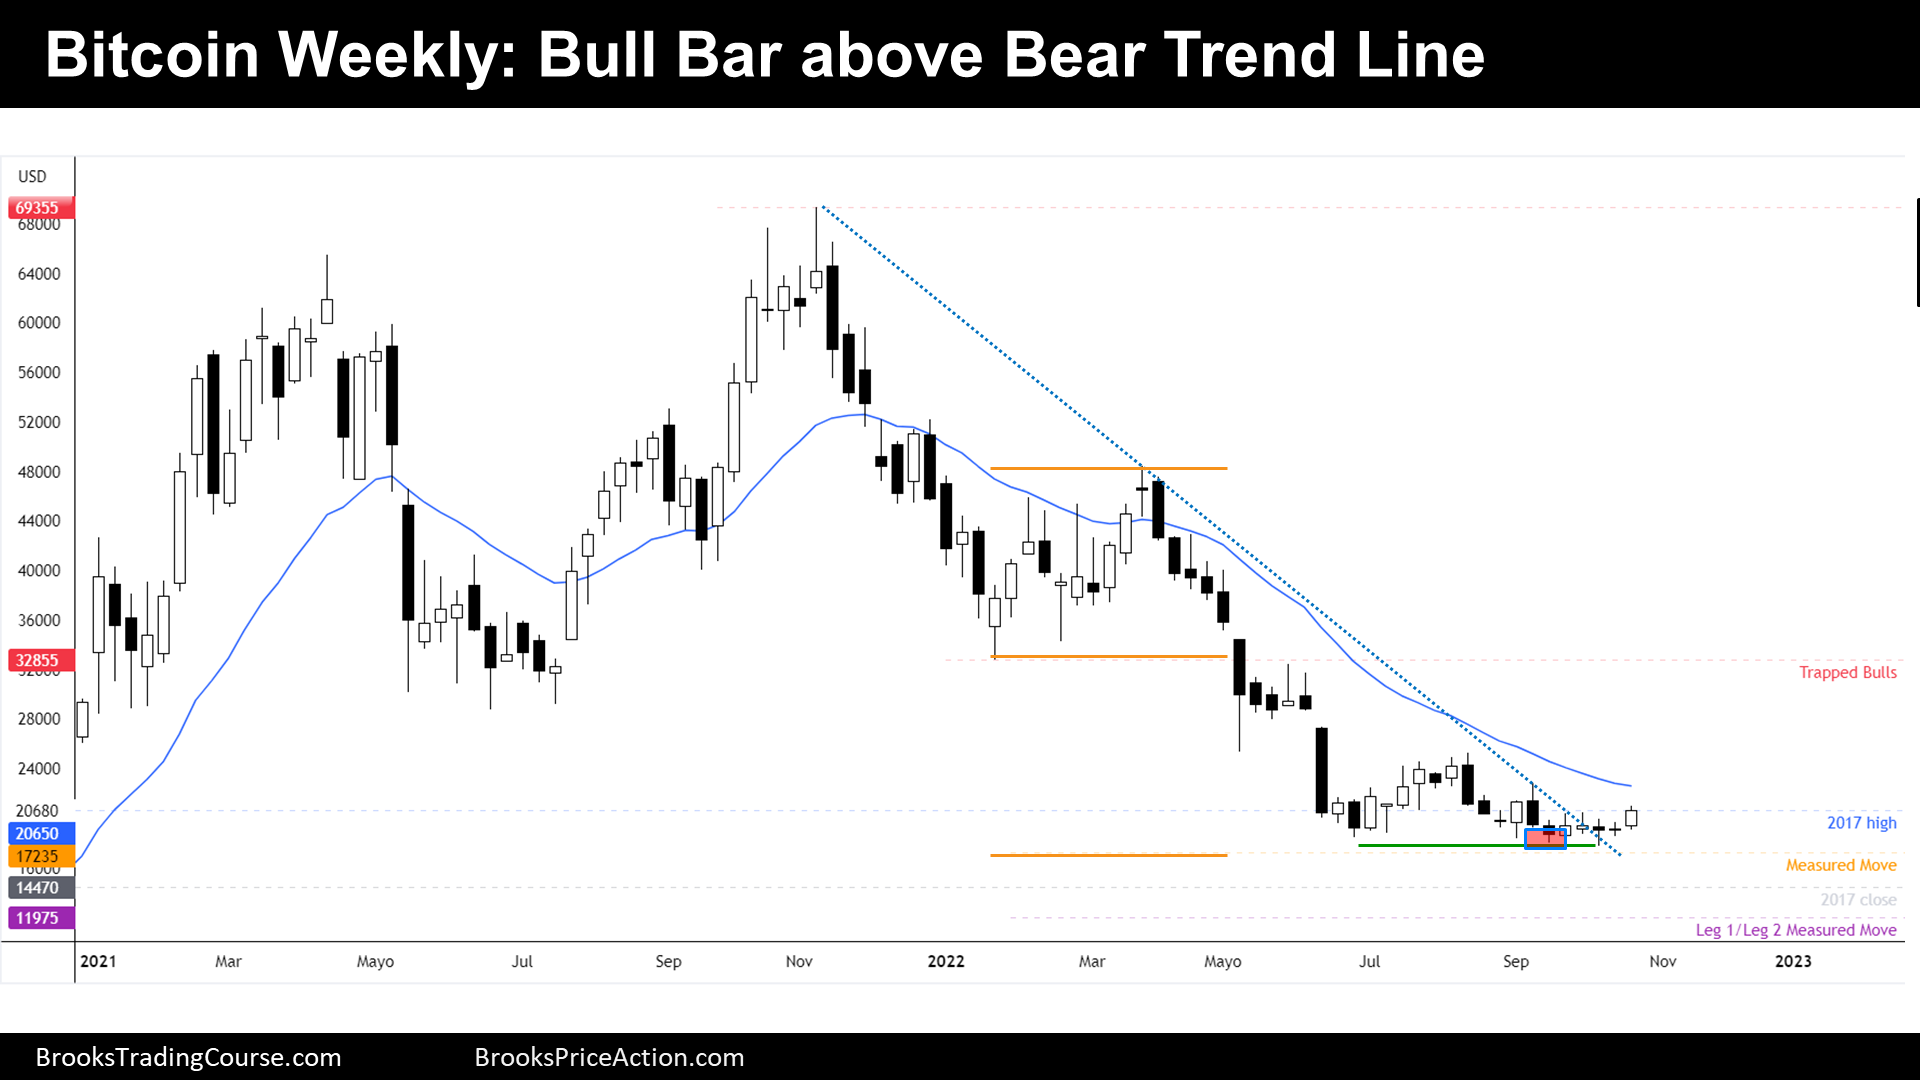
The Weekly Bitcoin chart

- Last week’s candlestick is a bull breakout bar, that is closing above past 5-week highs. Moreover, it is closing above the major bear trend line that was broken a few weeks ago by trading sideways. This week is a good bull signal bar for next week. The target for the bulls is the major lower high, at May highs.
- By trading sideways, traders remove importance on what was on the left of the chart, this means that the bear channel it is not as important as it was.
- Dominant participants, until this moment, were the bears that sold at the red box. But now, those bears will exit above the current bull bar.
- Bulls want a follow through bar next week. They think that this could be the start of a bull trend reversal. But the 2nd leg of the bear channel was strong enough to anticipate that the best that bulls can get is a trading range.
- Bulls want to test August highs and then May highs, which is currently the major lower high.
- Bears want a gap down on Monday and a continuation of the bear trend, but if the price trades above the bull bar, they will probably exit their shorts. In that case, they will look to sell again after a double top around August highs, or a failed breakout of the 20-week moving average.
- If the price is going to continue down, the next target for the bears is a measured move based upon the dimension of the bear flag.
- Because the bull bar was good, and the context is getting weaker for the bears, we should expect higher prices for the following weeks. A test of the 20-week exponential moving average is imminent.
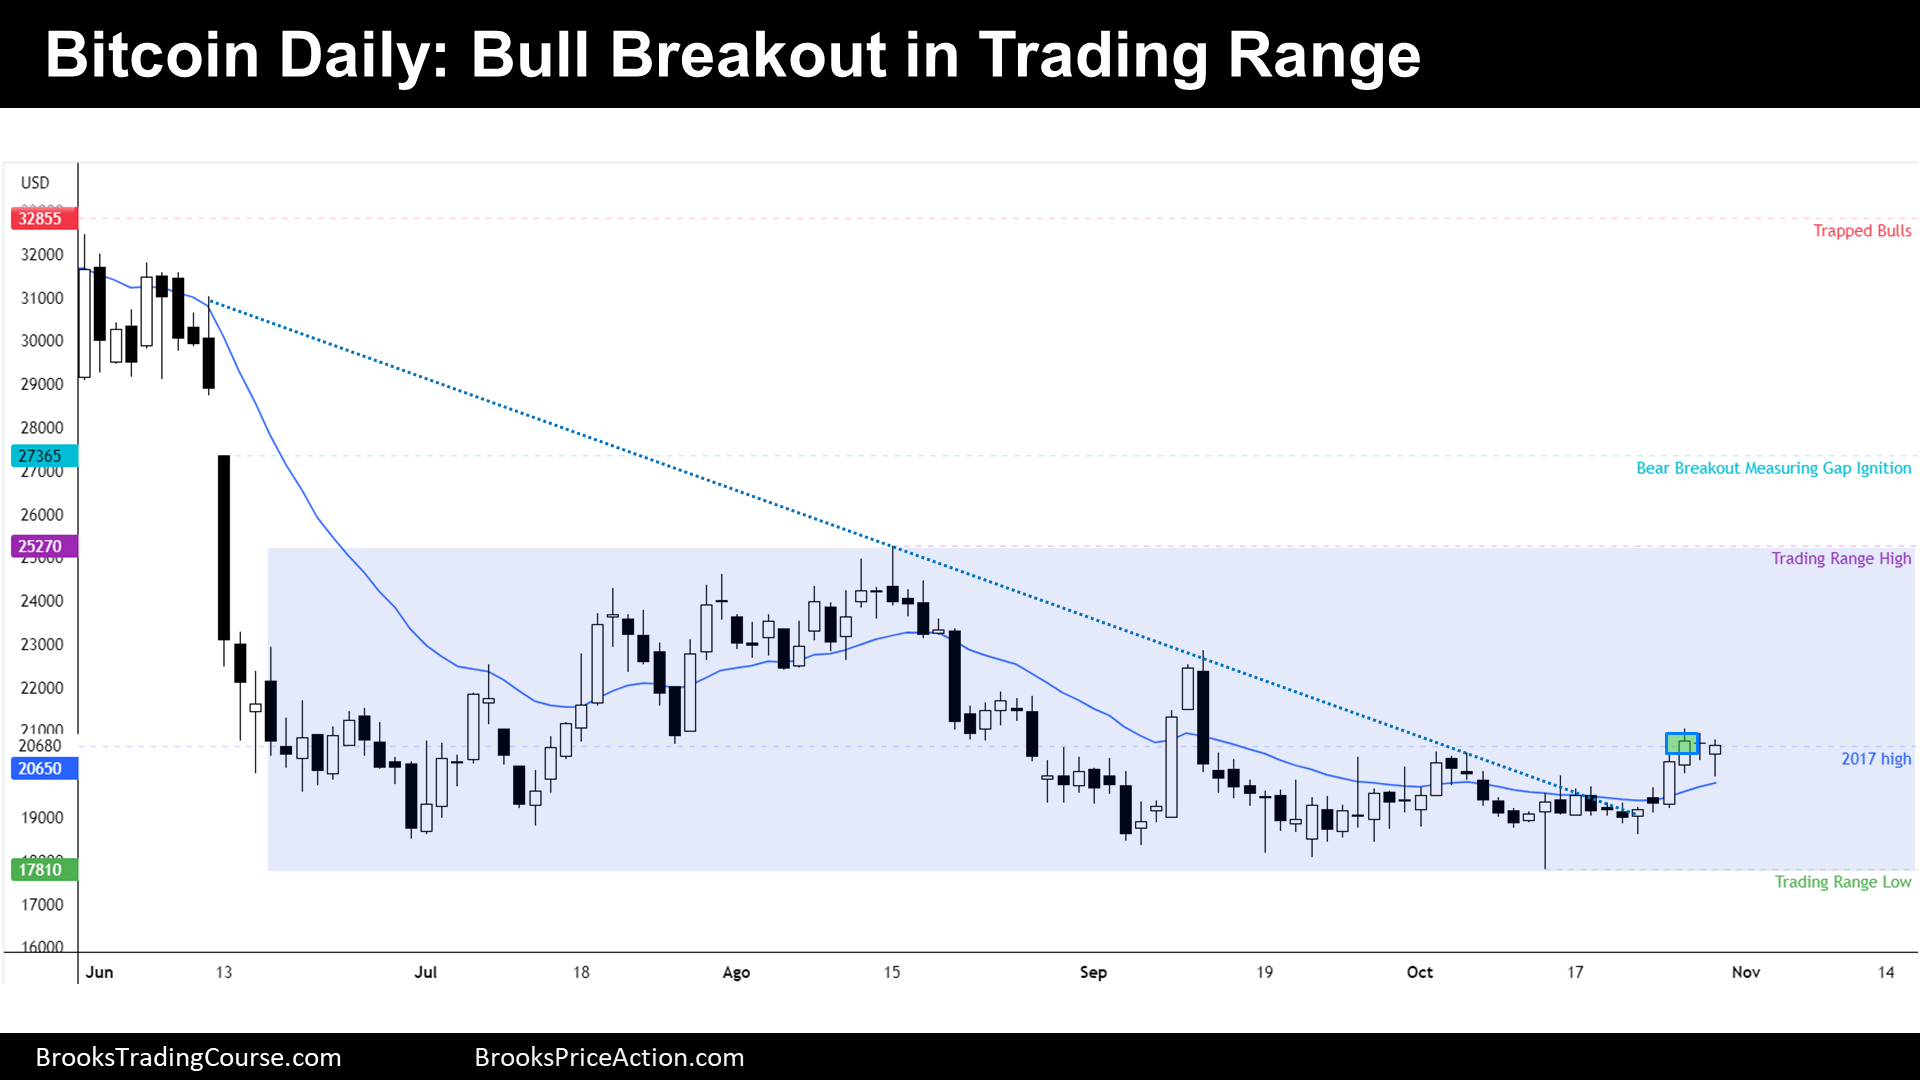
The Daily Bitcoin chart

- During the week, the bulls got consecutive bull closes above a bear trend line; Friday’s bull reversal bar is a high 1 after the bull breakout, a good buy signal bar for Monday.
- Price is within a buy zone of a 4-month Trading Range. The minimum target for the bulls is to trade at September highs, then the trading range highs.
- Bulls dominate this chart since the green box, there is no reason to get out this trade based upon current information. But a high 1 means 1 reversal on the bull trend.
- Swing traders let the price go against them once, not twice, normally. This means that bulls might exit below the next bear bar. If there is a bad follow through of the high 1 bull signal bar, traders might think there is a double top at resistance (2017 high). So far, bulls are in control, and hence, this might be the start of a bull breakout.
- Bears will find better odds if they wait to sell at the sell zone, which is located at the upper third of the trading range.
- Because the bulls have demonstrated fair strength within the buy zone, we should expect higher prices during the next following days.
Market analysis reports archive
You can access all weekend reports on the Market Analysis page.


Hi,
well the bulls seem to have had a follow through. It does not seem especially attractive, in any case, is it the least that they needed?
Perhaps that possible lack of strength on the part of the bulls could simply drive the price to a TTR to the highs of the summer. Perhaps that range, which would be the maximum that the bulls could expect right now, could be more ambitious and reach a kind of pivot around the lows of January, where you comment there could be long traps…
But, You know if they reach 100k , we will have a party “allà on Antònia Font en deia el petit iglú “
Thanks Josep.