Bitcoin’s Market Overview:
Bitcoin surged over 150% in 2023, marked by a Bull Run with a notable 5-month pause. The price nearly erased the impact of the 2022 bear breakout. Throughout the year, anticipation focused on the potential approval of a Bitcoin ETF. As 2024 approaches, all eyes are on the Bitcoin Halving, historically a focal point of popular interest. The burning question: Will 2024 extend the Bull Run, or is it a Bull Trap in disguise?
Bitcoin
The prices depicted on our charts are sourced from Coinbase’s Exchange Spot Price. It’s crucial to note that the spot price of Bitcoin is continuously in motion; trading activity never ceases. This means that market fluctuations and price changes occur around the clock, reflecting the dynamic nature of cryptocurrency trading.
The 1-year chart of Bitcoin

In this analysis, we explore which are the key supports and resistances and which is the dominant force that shapes the current trend. Looking forward, we anticipate the scenarios during 2024.
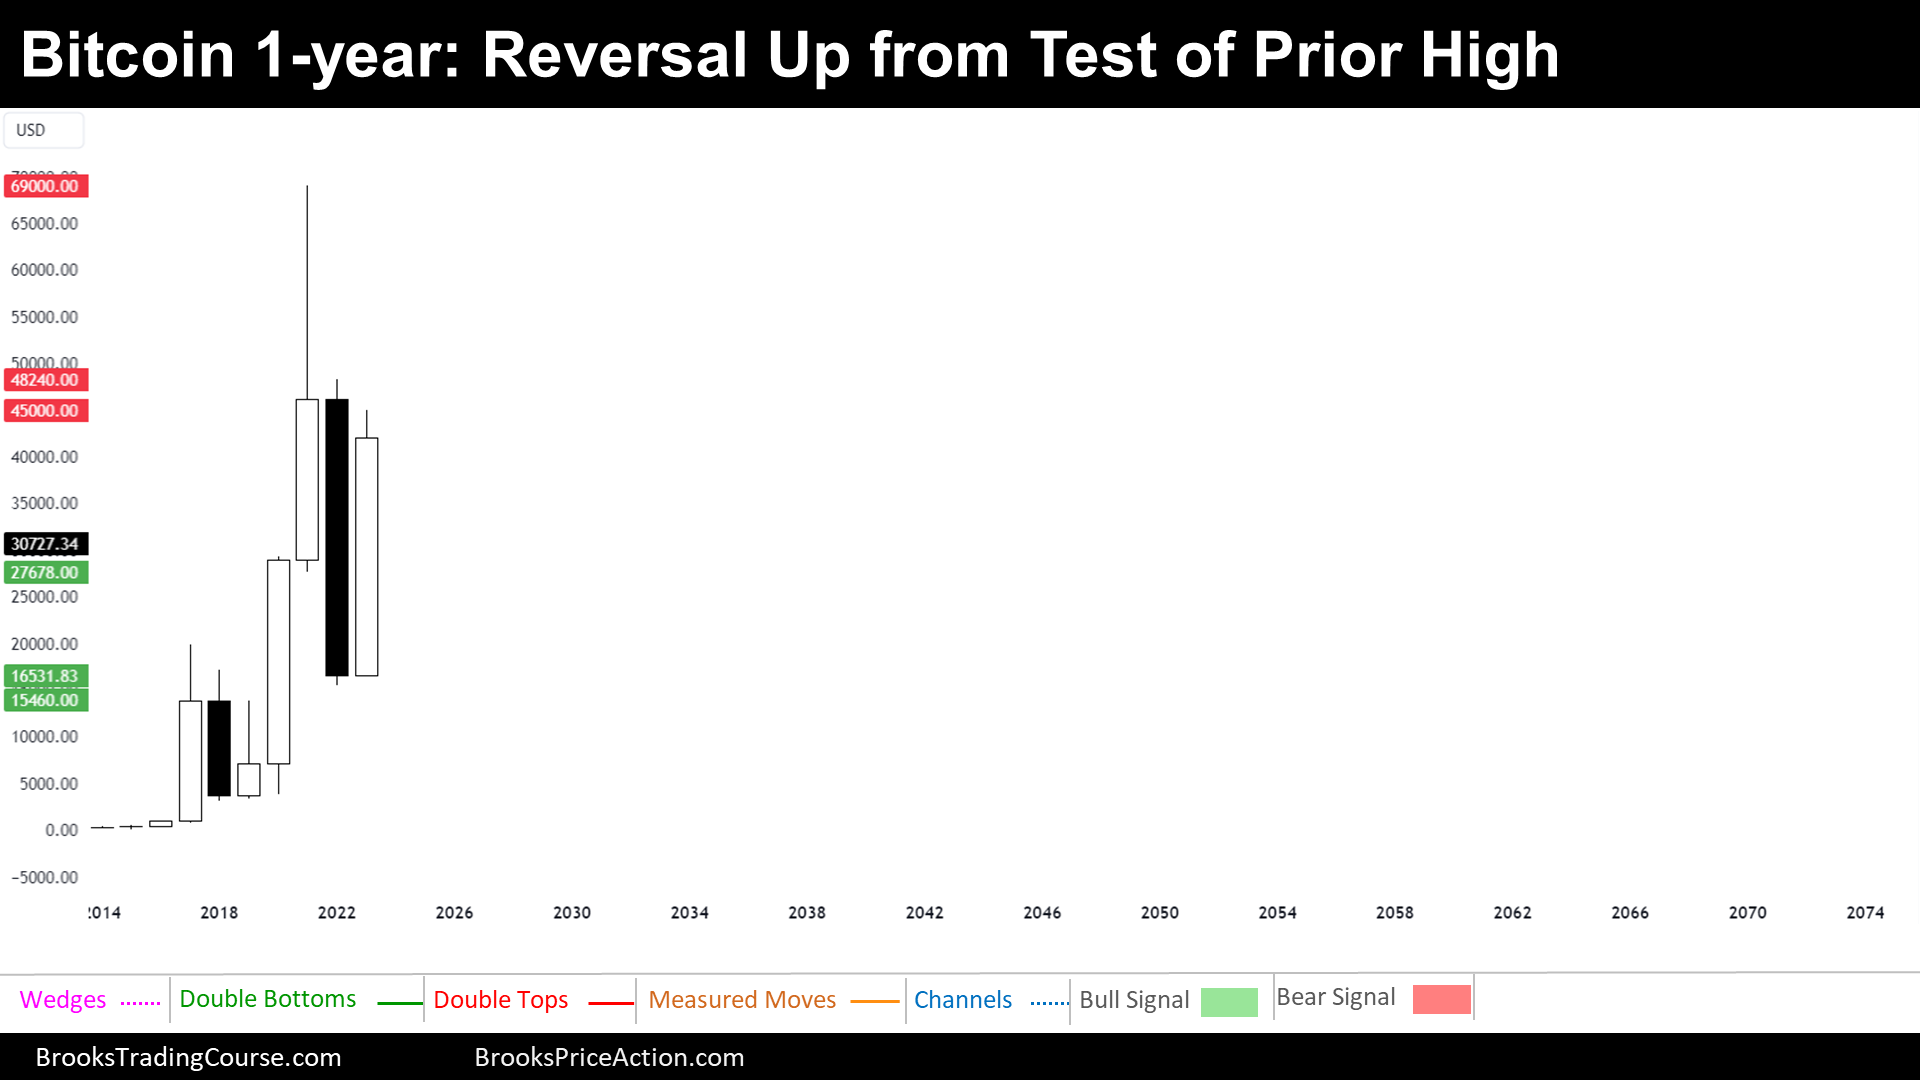
The prior Higher High, the prior all-time high, has acted as a solid support level, providing a foundation for the latest upward trajectory. On the flip side, there are notable resistances above, which include the 2022 high and the all-time high.
The dominant force is a Broad Bull Channel. This channel, indicative of a Bull Trend with profound pullbacks, is discernible in the yearly chart, reflected by achieving Higher Highs and Higher Lows.
Looking towards the future, the Bulls strategically engage in buying both at high points and during pullbacks. In contrast, bears adhere to a more conservative approach, selling only when prices are at their peak. During a Reversal Up from a pullback within a Broad Bull Channel, the Bulls make strategic decisions: they may sell prior poorly positioned longs to break even, take partial profits on well-timed longs acquired during the pullback or both things. This approach is rooted in the anticipation that a Broad Bull Channel will eventually transition into a Trading Range. In the current scenario, the price is entering a zone where both bulls and bears have sold previously, as evidenced by a conspicuous tail above the 2021 close, and the later sell-off in 2022.
In conclusion, it’s anticipated that in 2024, Bitcoin will likely experience a significant move, either up or down, of at least $15,000. The year 2023 is identified as a Bull Signal Bar, but it is located in a sell zone, potentially signaling a Bull Trap. The most probable outcome involves the price either trading downwards and testing the $35,000 mark or, if it continues on an upward trajectory, reversing to test the 2023 high before the year concludes.
The 3-month chart of Bitcoin

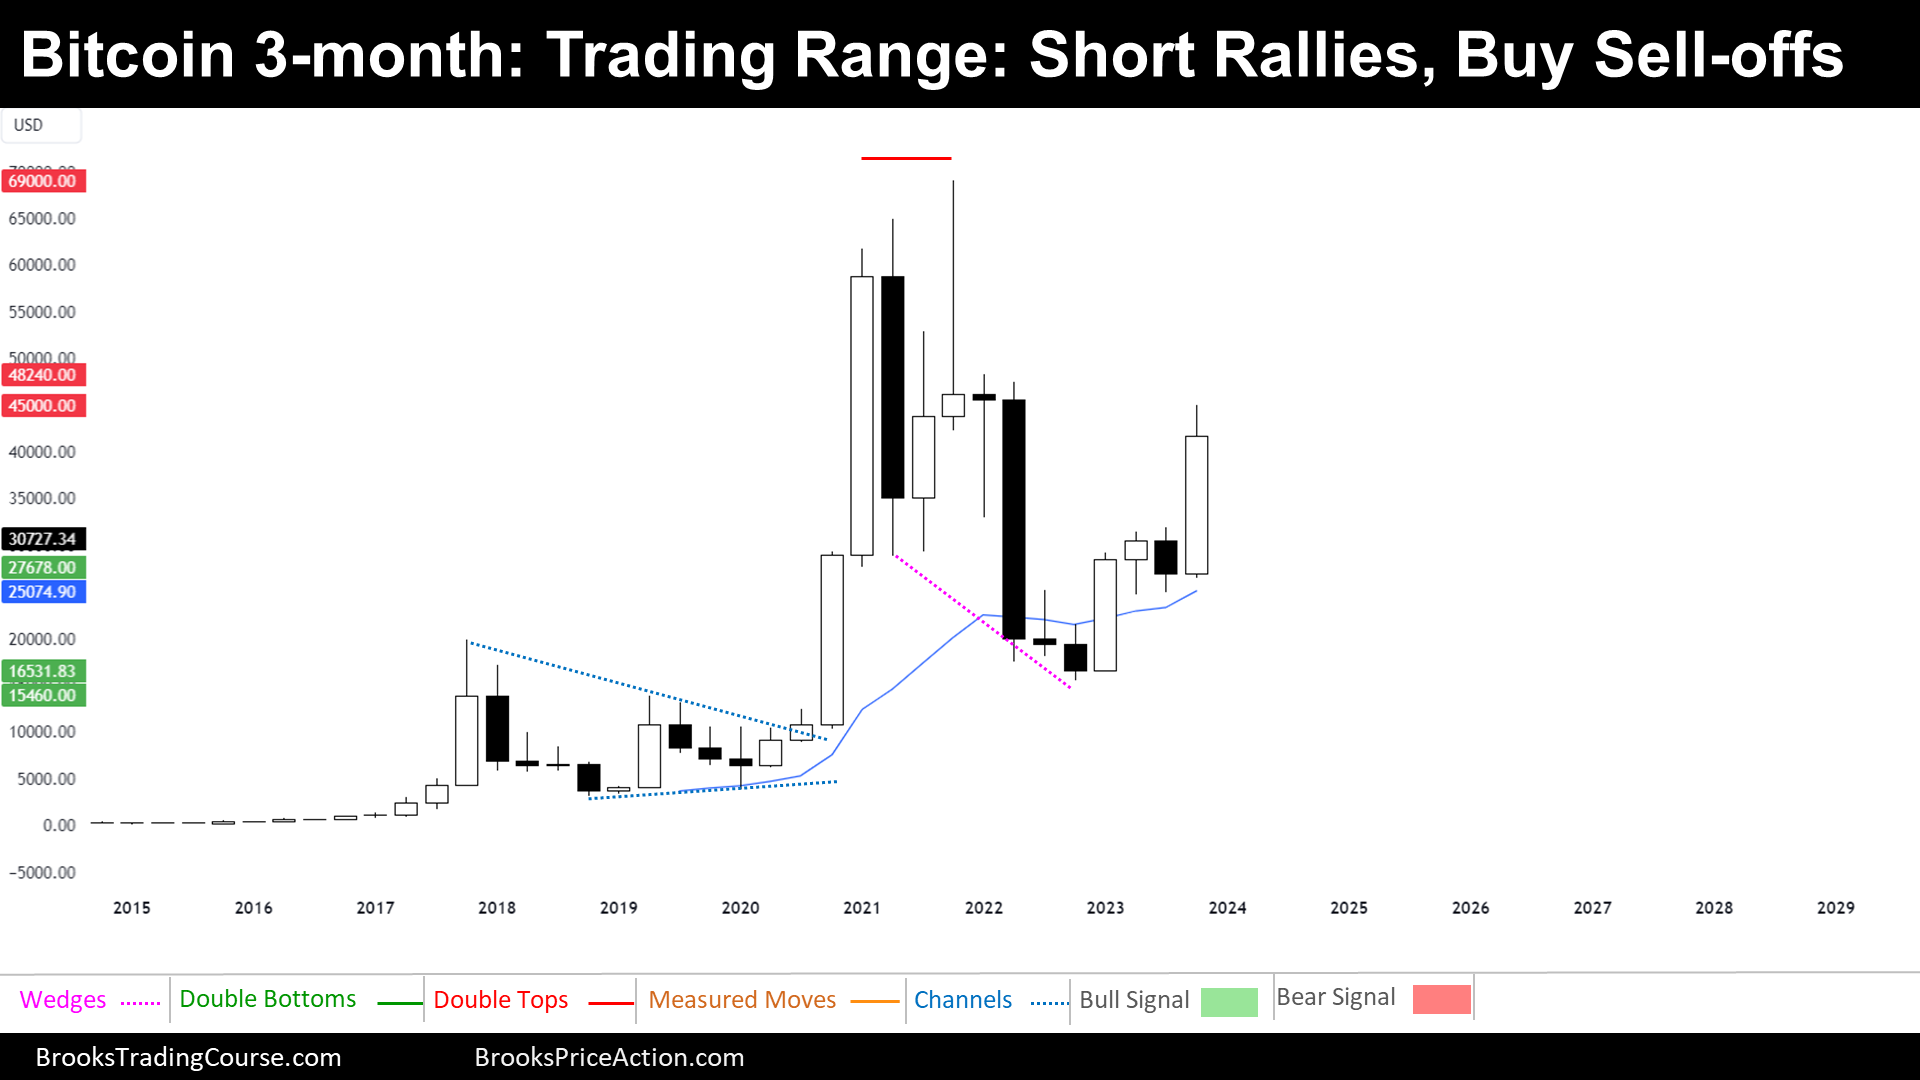
Delving into Bitcoin’s 3-month chart unveils pivotal levels steering market dynamics. Supports are identified within the Q3 2023 to Q4 2023 buy zone, setting the stage for upward shifts. On the flip side, resistances include the psychological $50,000 mark and the barrier posed by the 2022 high.
The identified supports encompass the buy zone between the Q3 2023 high and the Q4 2023 low. Contrarily, resistances include the psychologically significant $50,000 mark and the resistance posed by the 2022 high.
Examining the present scenario, the market cycle appears to be within a Trading Range. This observation is grounded in traders’ behavior, characterized by buying during sell-offs near supports and selling during rallies near resistances. A notable insight from the left side of the chart indicates a likelihood of another downward leg, even if the overall trend remains upward.
Looking ahead with a bias perspective, the market tends to gravitate towards the median of the range. Presently, the price hovers around the median, positioned between the all-time high and the 2022 low at approximately $42,000. Foreseeing potential limited movement, sideways bars may become apparent around this level. In Trading Ranges, traders typically seek buying opportunities at the lower third and selling prospects at the upper third.
Anticipating future scenarios, traders might consider a minimum $5,000 downward move if the price surpasses the upper third, starting above $50,000. Conversely, a $5,000 upward move may be expected if the price falls below the lower third, initiating below $33,000.
The Monthly chart of Bitcoin

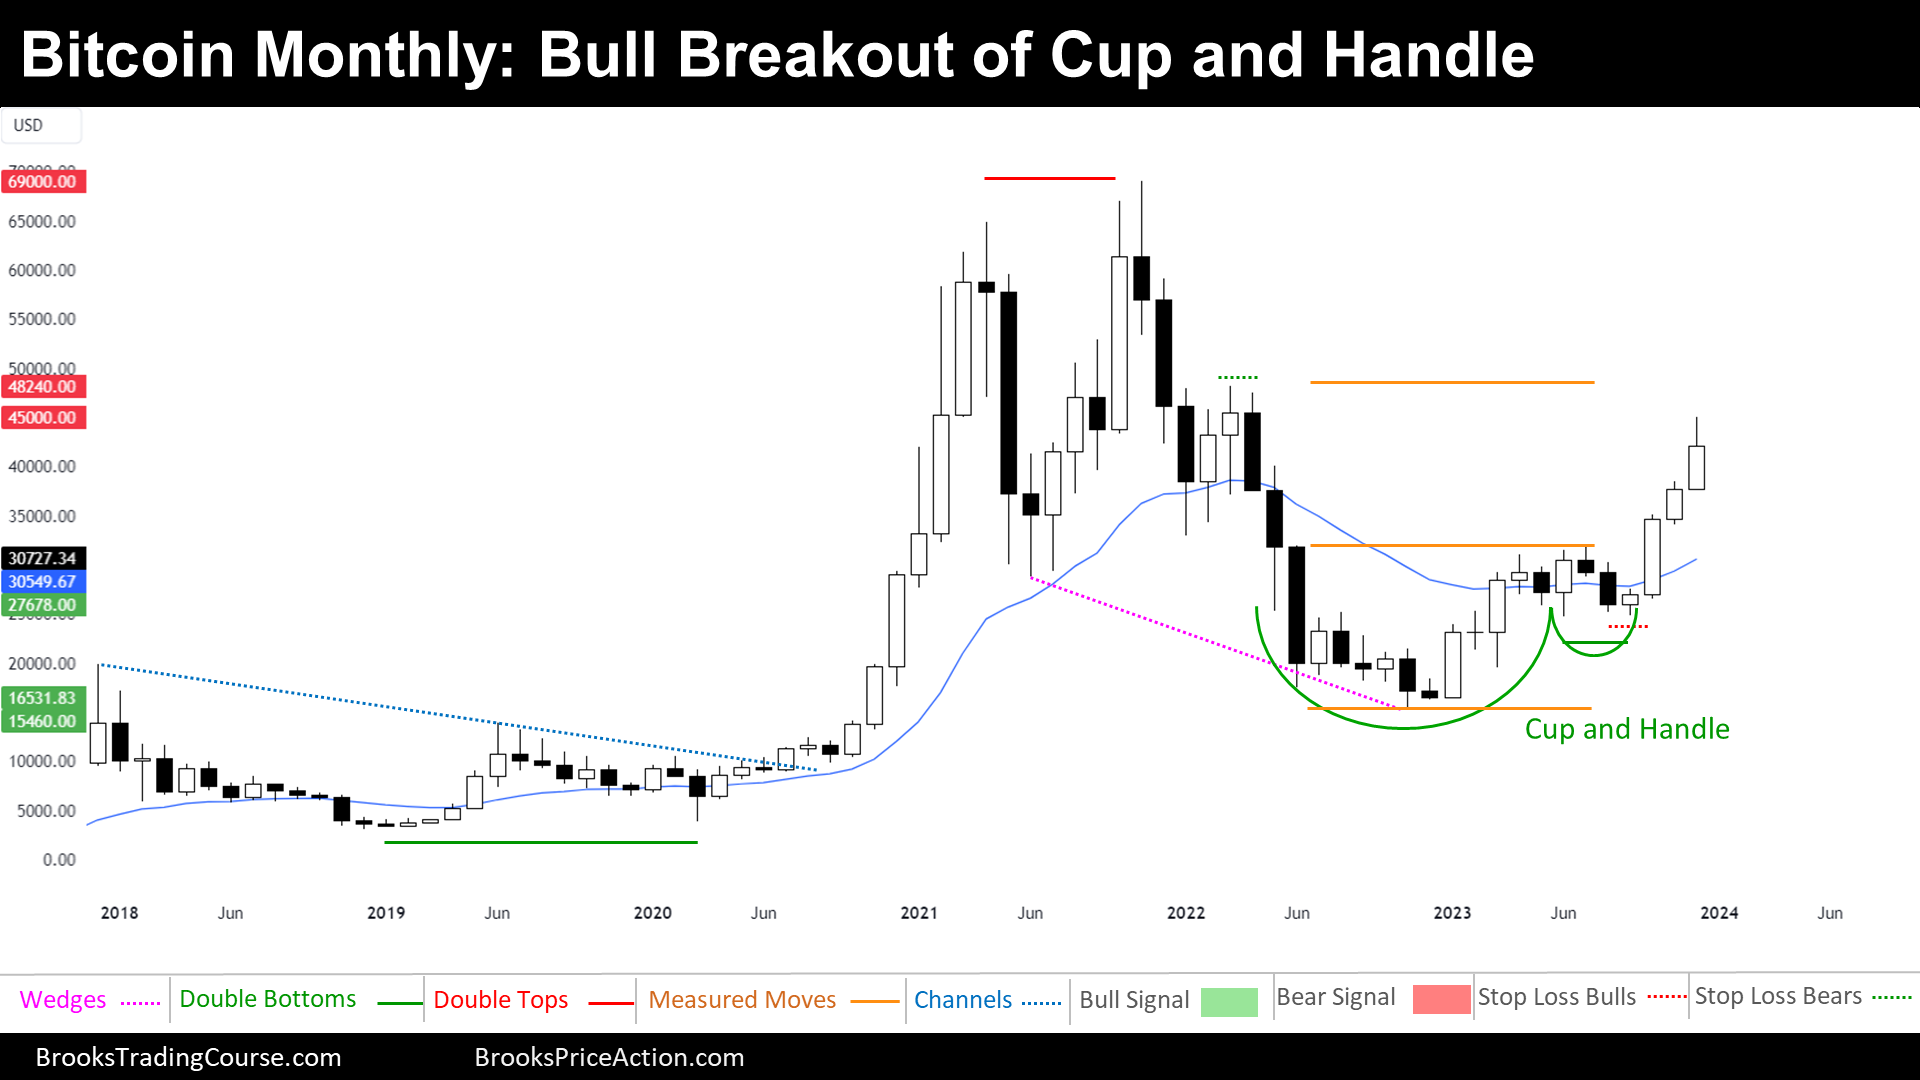
The current landscape signals a Bull Breakout, but the future trajectory poses the intriguing choice between continuation or reversal.
Supports include the November High and December Low, serving as foundational levels in the past. On the flip side, resistances are represented by the significant $50,000 mark, the 2022 high, and a Measured Move derived from the Cup and Handle pattern’s size.
The current market cycle signals a Bull Breakout, marked by a robust upward movement after a decisive break of the Cup and Handle Pattern. This breakout reflects a strong bullish sentiment in the market.
Post Bull Breakout, the future trajectory could take two paths: continuation or reversal. Continuation implies that any pullback will result in a new high before the price dips below the Bull Breakout’s low. Conversely, a reversal pattern suggests a move below the Bull Breakout’s low before achieving a Higher High.
While a reversal seems more likely contextually, the price may need to reach the Bear’s Stop Loss and the Measured Move Target before reversing downward. Until these conditions manifest, traders can anticipate sideways to up trading.
Traders should remain vigilant, considering the likelihood of a reversal instead of a Trend continuation.
The Weekly chart of Bitcoin

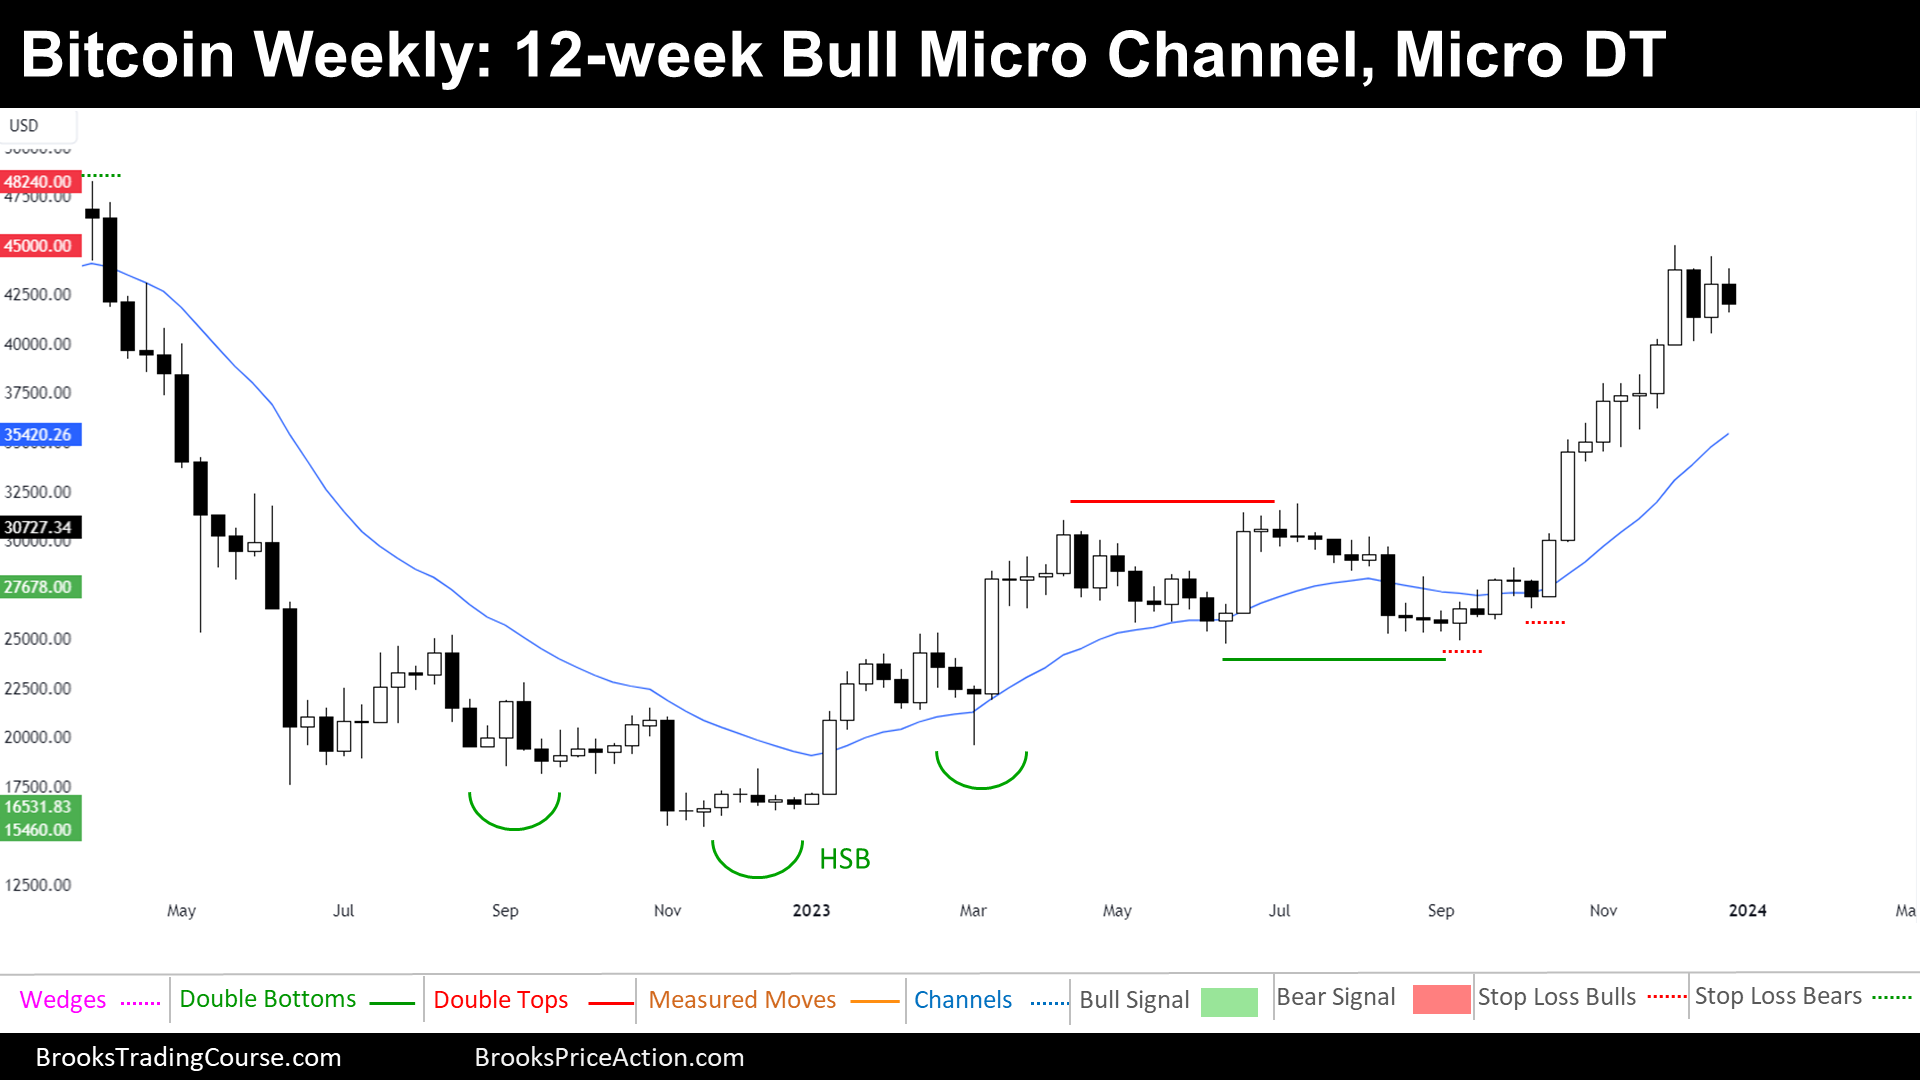
Delving into Bitcoin’s weekly chart, we uncover vital support at the Breakout Point of the Rectangle’s Breakout. A Bull Breakout seems to define the market cycle, yet signs of exhaustion prompt caution. As traders grapple with the complex interplay of resistances, the future trajectory introduces ambiguity within a potential Trading Range.
There is a key support at the Breakout Point of Rectangle’s Breakout. On the flip side, existing resistances manifest in the ongoing Sell Zone initiated by the 2022 Bear Trend, marked by a breakout at the current price area. Consistent with previous analyses, notable resistances persist at the 2022 high and the formidable $50,000 Big Round Number.
The current market cycle unfolds as a Bull Breakout, although signs of exhaustion emerge due to the absence of pullbacks; however, sideways trading emerges as a balancing act, which might be how the current Breakout is transitioning into a Tight Bull Channel Market Cycle. Despite this appearance, astute traders, considering higher time frames, recognize the price’s encounter with robust resistance, challenging the notion of a Spike and Channel Bull Trend.
The future trajectory introduces confusion, a hallmark of a Trading Range. Traders, hesitating to buy amid the Bull Breakout due to perceived resistances, find themselves in a quandary. Bears are reluctant to sell without clear bearish setups. If, as suggested, this is a Trading Range, Bulls may seek opportunities in a deep pullback, possibly below the low of the Bull Breakout.
In summary, the analysis, illuminates the present Bull Breakout with nuanced considerations, and speculates on the complex future within a potential Trading Range. The market’s intricacies demand a strategic approach as participants navigate the evolving landscape.
As we conclude this market overview, we want to express our sincere gratitude to you, dear readers, for joining us on this journey of market analysis. Your engagement and enthusiasm make this endeavor truly rewarding. As we step into the new year, filled with the promise of potential market shifts and exciting developments, we wish each of you a joyous and prosperous New Year. Please have no hesitation to share your insights, predictions, and questions in the comments section below. Let’s continue this dialogue and make 2024 a year of shared knowledge and collective growth. Happy New Year!
Josep Capo
Market analysis reports archive
You can access all the weekend reports on the Market Analysis page.


Thank you!!!!!
Hola Drew!
You’re very welcome! I’m glad you found the Bitcoin analysis helpful. If you have any more questions or thoughts, feel free to share them.
Wishing you a fantastic New Year filled with joy, prosperity, and successful endeavors!
Best regards,
Josep
Thanks Josep for excellent PA analysis! Happy new year and all the best. On the yearly and quarterly charts we can clearly see the body gap bulls are maintaining on the move up so I assume 2nd leg up will follow towards the start of the 1st leg of the wedge bottom, this is also could be inline with your trading range long term anticipation.
Hola Eli!
Thank you so much for your thoughtful comments and for sharing your insights again on the Bitcoin Report! I appreciate your keen observation regarding the yearly and quarterly charts, highlighting the body gap that the bulls are maintaining. It’s always enriching to engage with you as you contribute valuable perspectives to the discussion.
Wishing you a Happy New Year filled with prosperity, success, and exciting opportunities in the world of trading and beyond. May the upcoming year bring you joy and fulfillment.
Looking forward to more insightful exchanges in the future!
Best regards,
Josep