Market Overview: Bitcoin Futures
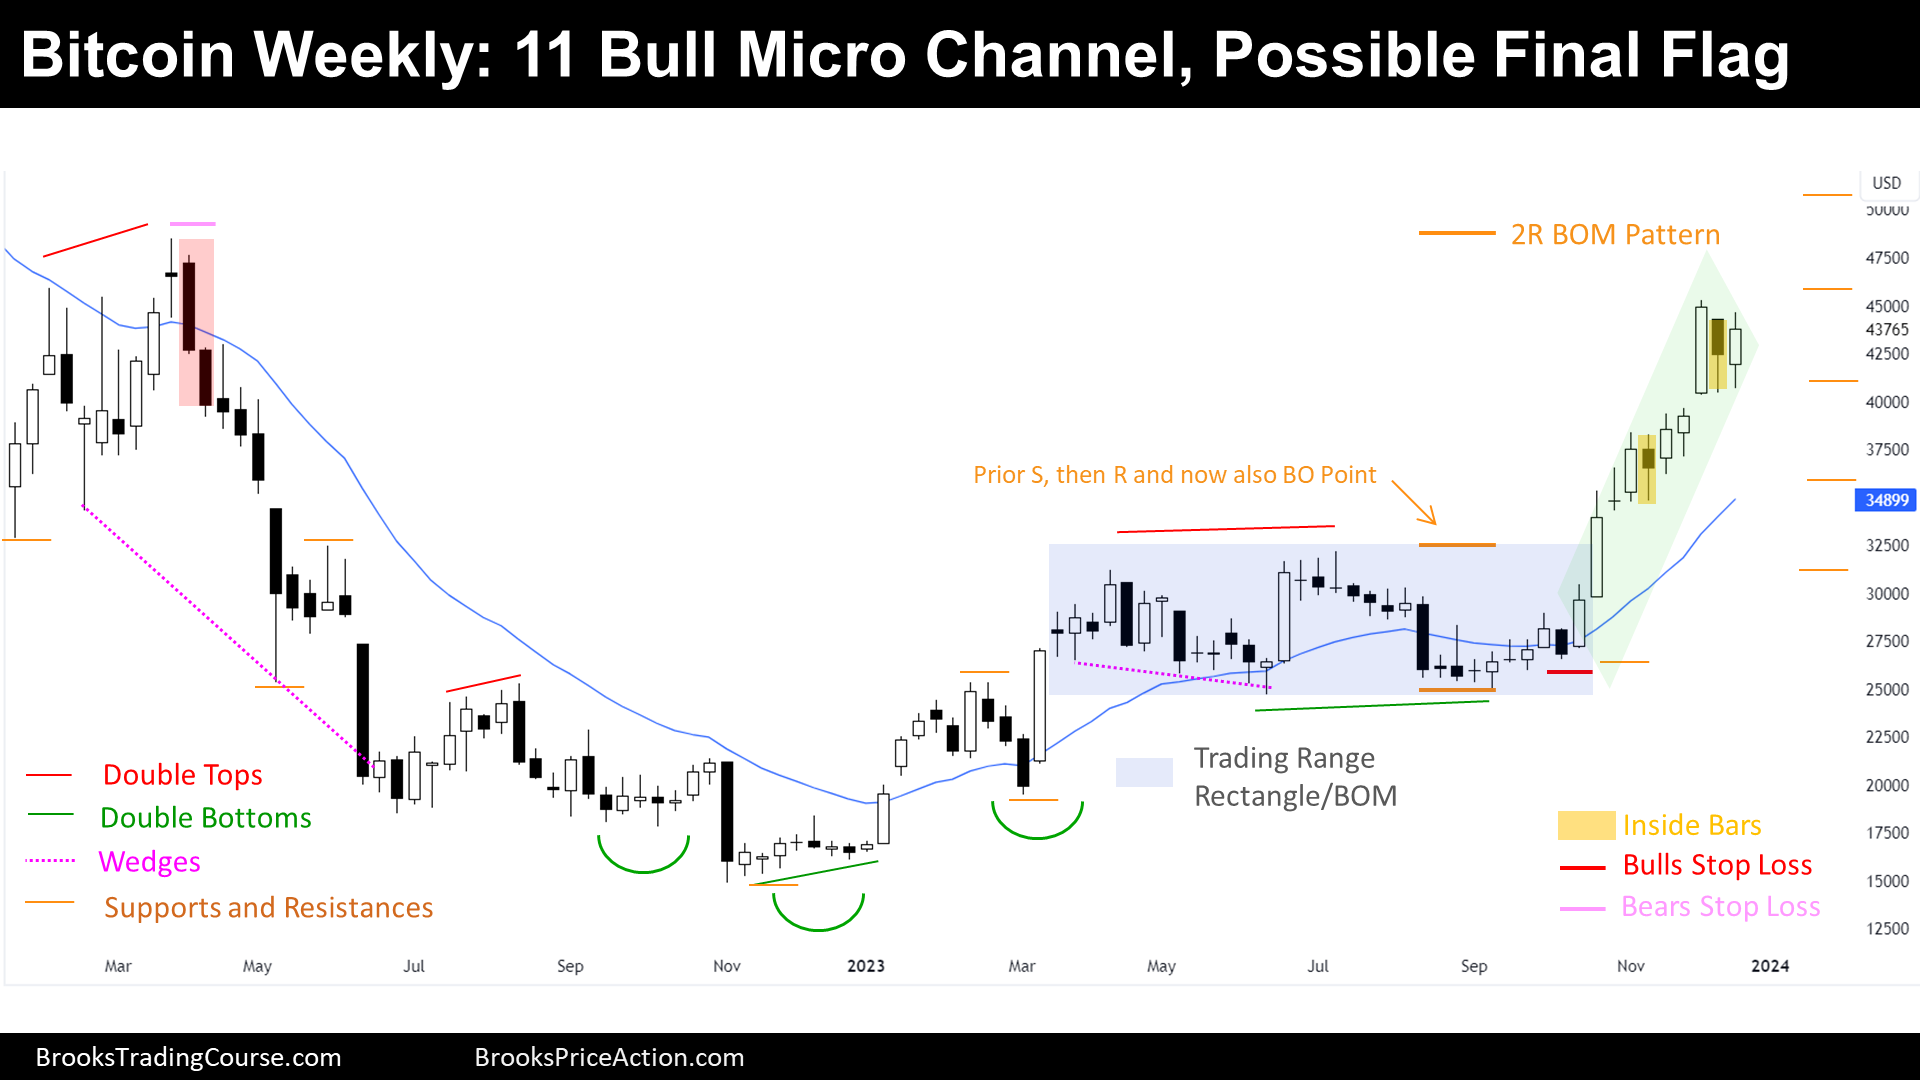
Bitcoin continues the bull micro channel by avoiding, per 11th consecutive week, trading below the prior weekly low. This upcoming week, is the last trading week of 2023; So far, the price of a Bitcoin increased its value by +160% respecting 2022’s close. Hence, the next weekly close will settle a price that will be important for traders during the upcoming years.
Next week, we will post a special End of the Year Bitcoin Report, in which we will dissect the price action on 1-year, 3-month, monthly and weekly charts.
Bitcoin futures
The Weekly chart of Bitcoin futures

Bulls and Bears Map
- Bulls:
- Their Stop Loss is likely below the 11-bar Bull Micro Channel low.
- Bull’s Stop Loss are “Sell at the Market” orders.
- Their Stop Loss is likely below the 11-bar Bull Micro Channel low.
- Bears:
- If there are weekly Bears, their Stop Loss is most likely above the 2022’s high.
- Bear’s Stop Loss are “Buy at the Market” orders.
- If there are weekly Bears, their Stop Loss is most likely above the 2022’s high.
Market Cycle
- The Market Cycle looks like a Bull Breakout:
- During a Bull Breakout, Traders buy High.
- But after a late strong Bull Breakout Bar, the price reversed down.
- Traders are not buying high anymore.
- If the Bull Breakout is over, ¿what is this?
- The Spike of a Spike and Channel Bull Trend.
- Or a Bull Leg of a Broad Bull Channel.
- Or a Bull Leg into a Trading Range.
- ¿What is more likely?
- Judging on higher Time Frames, a Trading Range is more likely.
- The price is still within the 2022’s price range.
- 2023 is an Inside Bar on the Yearly Chart.
- An Inside Bar represents a Trading Range pattern.
- A Trading Range pattern can be a continuation pattern or reversal pattern.
- The price was coming from a +75% drawdown, and hence, the prior context was not bullish.
- Reversal pattern likely.
- The price was coming from a +75% drawdown, and hence, the prior context was not bullish.
- A Trading Range pattern can be a continuation pattern or reversal pattern.
- An Inside Bar represents a Trading Range pattern.
- 2023 is an Inside Bar on the Yearly Chart.
- The price is still within the 2022’s price range.
- Judging on higher Time Frames, a Trading Range is more likely.
- The Bull Breakout is probably a Bull Leg in a Trading Range.
Inertia
- Traders expect a reversal.
- Since this is likely just a Bull Leg in a Trading Range.
- After a Bull Leg in a Trading Range, comes a Bear Leg.
- Since this is likely just a Bull Leg in a Trading Range.
- Bulls are taking profits, but if there are not enough Bears willing to sell around this area, the price might vacuum test the Bear’s Stop Loss to find its counterparty.
- Until there is not a Bear Sell Setup, more likely trading towards Bear’s Stop Loss.
- If there is another push-up, the price will draw a Parabolic Wedge Top and the odds of a reversal will increase.
Trading
This week’s candlestick is a Bull Bar closing above its midpoint but with prominent tails on both ends: Not an obvious good bull signal bar. Neither a sell signal bar.
- Bulls:
- They are not likely to buy high.
- More likely, they are taking profits.
- Their risk is too big if they maintain the original Stop Loss:
- They probably took partial profits along the way and have their Stop Loss above their entry price:
- The Breakout Mode Pattern High.
- Above the high of the Bull Breakout Bar that broke the Breakout Mode Pattern.
- They probably took partial profits along the way and have their Stop Loss above their entry price:
- Their risk is too big if they maintain the original Stop Loss:
- Bears:
- They might sell after a Bear Signal Bar.
- If there is a Bear Signal bar next week, they will see a micro double top during a Bull Climax.
- After a Parabolic Wedge Top formation.
- After a Low 2 sell Signal.
- They might sell after a Bear Signal Bar.
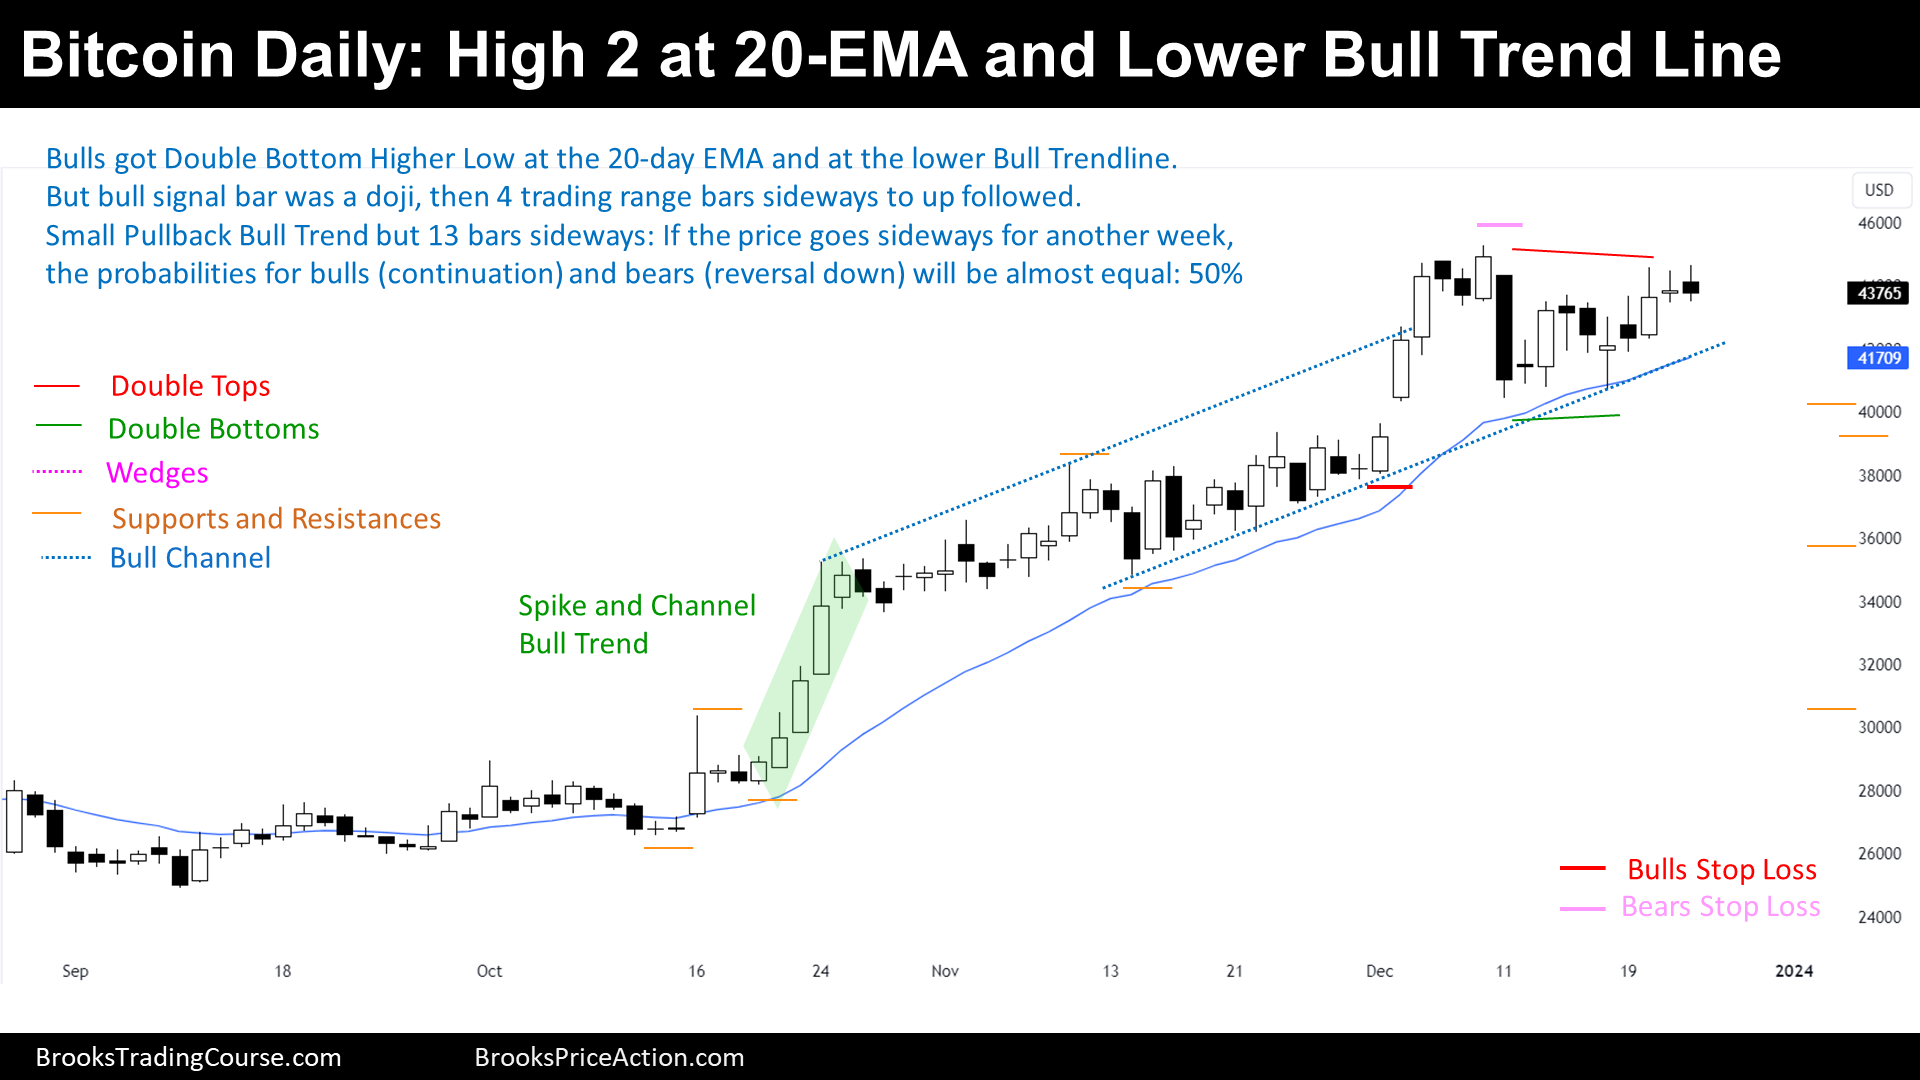
The Daily chart of Bitcoin futures

Bulls and Bears Map
- Bulls:
- Their Stop Loss is below the Bull Breakout Low.
- If there is a good bull bar or a couple of bull bars above near or above the 2023’s high, the Bulls Stop Loss will be moved below this week’s low (double bottom at 20-EMA).
- Bull’s Stop Loss are “Sell at the Market” orders.
- Bears:
- Their Stop Loss is above December high.
- Bear’s Stop Loss are “Buy at the Market” orders.
- Their Stop Loss is above December high.
Market Cycle
- The market cycle is a Small Pullback Bull Trend.
- The Small Pullback Bull Trend is also a Spike and Channel Bull Trend.
- The Trend has finally tested the 20-day Exponential Moving Average.
- Which had confluence with the lower Bull Channel trend line.
- Then, reversed up.
- Not strongly, a doji bar was the bull signal bar.
- 4 trading range bars, sideways to up followed.
- Not strongly, a doji bar was the bull signal bar.
- Then, reversed up.
- Which had confluence with the lower Bull Channel trend line.
- If the market stays sideways for another week, Traders will consider that the Small Pullback Bull Trend transitioned into a Trading Range.
- This sideways market since a couple of weeks ago, draws a Bull Flag, which could be either a Continuation pattern or a Final Flag.
- The context on a higher time frame suggests that it is more likely a Final Flag.
- $44815 is a strong magnet since it is the 2021 close. Since this week is the last trading week of the year, It could be a magnet and hence, the odds of an 2023 during the next week increase:
- Bears Stop Loss will likely be taken before there is a reversal down.
Trading
- Bulls:
- Bulls that were in the Trade, probably took most of their profits during the past Bull Breakout, or they will exit below a Bear Bar, thinking that this is a Double Top Lower High.
- Bulls that bought at the 20-day Exponential Moving Average might took also partial profits by now, or they will take their partials when the price trades at the actual 2023 high.
- They should protect their position since the Bull Breakout on the weekly chart is exhausting and there might appear a Bear Leg coming soon.
- Bears:
- Some Bears will sell below Friday’s low, which is a Low 2 and a Double Top Lower High.
- It is not a high probability setup.
- Moreover, it is not a Major Trend Reversal setup.
- It is not a high probability setup.
- If I were a seller, I would prefer to sell after a Failed Bull Breakout Setup of the Bear Flag.
- Weak Bears out of their Trade by the current Stop Loss and Weak Bulls Trapped into longs.
- Some Bears will sell below Friday’s low, which is a Low 2 and a Double Top Lower High.
See you next week in a Special Report.
¡Merry Christmas to all our wonderful readers! In this season of joy, may your hearts be filled with warmth and laughter. May the spirit of Christmas bring peace to your homes and love to your hearts.
Josep Capo
Market analysis reports archive
You can access all the weekend reports on the Market Analysis page.


Merry Christmas, Josep, very interesting analysis, especially the magnate to bear stop loss. Thank you
Thank you very much, Elijah! Al Brooks talks all the time about what weak bulls and bears are doing. If there is a bias, Traders positioned on the wrong side of the bias are likely going to be stopped out of their trade.
Josep.