Monthly S&P500 Emini futures candlestick chart:
Follow-through buying after last month’s breakout
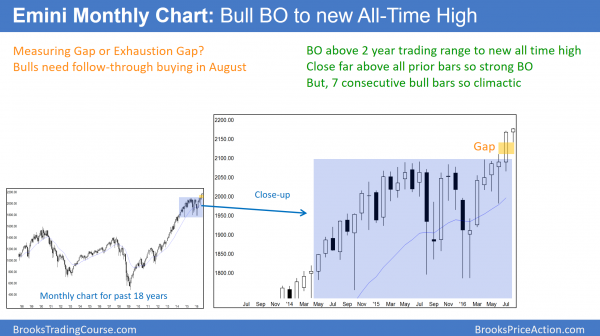
The monthly S&P500 Emini futures candlestick chart had 6 consecutive bull trend bars coming into this month. Last month was a strong bull breakout. The bulls want a bull trend bar this month to confirm last month’s breakout. Yet, 6 consecutive bull bars on the monthly chart is climactic. The odds favor a bear body when the bar closes at the end of the month. Traders need to be ready for a possible August buy climax and correction.
The monthly S&P500 Emini futures candlestick chart has rallied for 6 consecutive months. This is therefore strongly bullish. Six consecutive trend bars on the monthly chart is unusual and hence unsustainable and climactic. Therefore, August will probably be a bear bar. Hence, it will probably close below its open. Because the Emini is early in the month, it could rally for several weeks before reversing back down below the open of the month.
Alternatively, it could selloff all month. It is too early to be planning trades based on this information. Yet, traders should be wary if the Emini is above the open of the month late in the month. The odds would then favor a selloff to below the open of the month. If the bulls get a 7th consecutive bull trend bar, then the odds would favor a bear bar in September. This is despite the strong bull trend.
Weekly S&P500 Emini futures candlestick chart:
Resumption of the July rally, but August buy climax and correction?
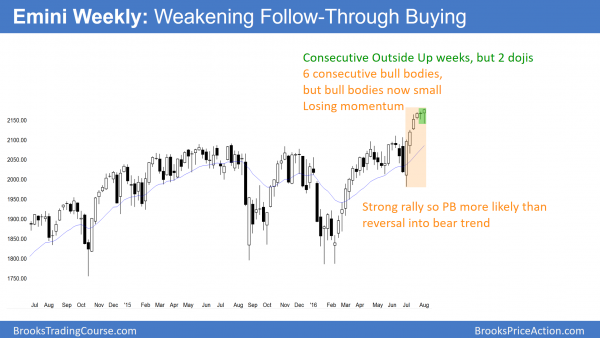
The weekly S&P500 Emini futures candlestick chart had a strong rally in July. After 2 weeks of a sideways pause, the bulls created an outside up bar this week. They therefore once again took control. Because this week was a doji and it comes after another doji, a small bar, and a climactic rally, the Emini will probably pull back more within the next few weeks.
The weekly S&P500 Emini futures candlestick chart has rallied for 6 weeks without a bear body. This is a strong bull breakout above the 2 year trading range. Yet, the bodies of the 1st 5 weeks shrank. Hence, the bulls were getting less eager to buy as the price moved higher. This past week traded below the prior week’s low and then above its high. It therefore was an outside up week. Yet, its body was small, which is a sign that the bulls are less willing to buy at the highs. As a result, bears will begin to sell new highs for scalps, and bulls will start taking profits at new highs.
This is the earliest indication that a bull breakout might start to pull back. With the rally as strong as it has been, the odds are that bulls will buy the pullback. Additionally, bears believe that the reversal would be minor. They therefore will buy back their shorts when they have a small profit. This unwillingness to let the Emini fall too low will limit the depth of the reversal. Therefore, a bull flag is more likely than a trend reversal.
Daily S&P500 Emini futures candlestick chart:
Strong breakout to a a new all-time high
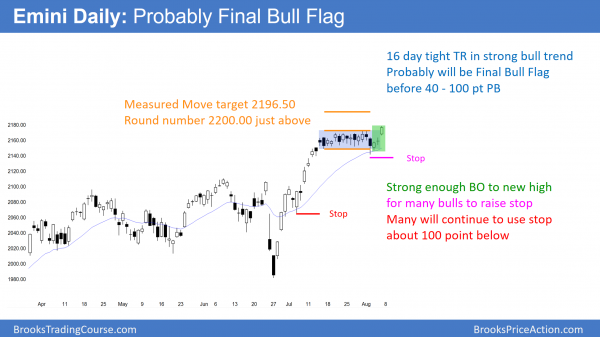
The daily S&P500 Emini futures candlestick chart gapped up on Friday and broke to a new all-time high. Because the bar was a big bull trend bar, the bulls were strong. Therefore the odds favor at least a little more buying next week.
The daily S&P500 Emini futures candlestick chart this week had a breakout below the 3 week trading range. Yet, bulls bought the test of the moving average, which was a 20 Gap Bar buy setup. The bulls were strong enough to rally above the top of the trading range to a new all-time high on Friday. However, just as a tight trading range resisted the downside breakout, it will tend to resist this upside breakout as well. Hence, it might be the Final Bull Flag.
Nested failed bear breakouts
This reversal up for below a trading range is a nested pattern. A nested pattern has a smaller version of the pattern in the final leg. Sometimes the final leg has an even smaller version of the pattern. The Emini has a nested pattern that involves its 2 year, 3 month, and 3 week trading ranges.
The Emini was in a trading range for 2 years. The bears broke below the range in January, yet reversed up strongly to a new high. The Emini then was in a 3 month trading range earlier this year. After a strong breakout below this smaller range in June, the bulls again strongly bought the bear breakout. This led to another all-time high. Finally, the Emini was in a tight trading range for the past 3 weeks. The bears got a breakout this week, yet the bulls again bought the bear breakout. As a result of their strong buying, the Emini again moved to a new all-time high on Friday.
A nested pattern has a higher probably of a profitable reversal. Yet, there is still no top. The 3 week trading range might become the Final Bull Flag, but the bears need a reversal setup or a strong bear breakout. While the reversal will probably come in August, there is no sign of either yet.
Targets for the bulls
The Emini is in a strong bull trend on the daily, weekly, and monthly charts. Bulls will look to take profits at Measured Move targets. They base most of them on the heights of Trading ranges. The June 23 – July 1 double top was about 100 points tall. Its target is around 2200. The height of the 3 week trading range was also about 100 points tall. Many computers will ignore the June 27 bear breakout. They will see it as an outlier and simply a brief poke below the 100 point range.
The most important measure move target is based on the 300 point height of the 2 year trading range. That target is around 2400. The bulls have a 40%b chance of getting there without first seeing a 100 point pullback.
Targets for the bears
While there is a 60% chance that the current rally will not last all of August, there is no top yet. If the Emini begins to reverse next week, the first target for the bears is the top of the 3 week trading range. The bears need to close the gap between Friday’s close and the top of the range. Other targets are the gap below Friday’s low and the June high top of the 3 month trading range.
There is still a 60% chance of a 40 – 100 point pullback in August. A 100 point pullback is near the July 6 low. That was the 1st pullback in the July reversal. Because scale in bears theoretically begin selling there, they will continue to sell above that price until the Emini falls to around their 1st entry. Once there, they buy back their shorts. They get out breakeven on that 1st short on July 7, while making a profit on their higher entries.
Traders can see the end of the day bar-by-bar price action report by signing up for free at BrooksPriceAction.com. I talk about the detailed Emini price action real-time throughout the day in the BrooksPriceAction.com trading room. We offer a 2 day free trial.
When I mention time, it is USA Pacific Standard Time (the Emini day session opens at 6:30 am PST, and closes at 1:15 pm PST). You can read background information on the intraday market reports on the Intraday Market Update page.


When I look at the price pattern May 10, May 19, June 8, June 27, July 20 isn’t this also an expanding triangle with a superimposed smaller nested triangle between July 20 and August 5?
Yes, I agree. My concern is that when the 3rd leg lasts 10 or more bars, comps give up on it and look at it as something else. I talked about the Expanding Triangle a couple of weeks ago. I think the nested tight trading ranges with the failed bear breakouts is now the dominant pattern. However, that failed bear BO and then the rally to a new high often creates an Expanded Triangle, and it is reasonable to call the current 2 year pattern a nested Expanding Triangle.
It does not matter what we call what is going on. What matters is that the market is overbought on the all time-frames. There is no clear top yet. It might have a buy vacuum up to the 2200 – 2220 targets above. I think bulls will be quick to take profits and bears will be quick to sell. This could result in 100 points down in just 2 weeks. Because of the strong bull trend, it will be easy for bears to miss the short if they are in denial. Yet, there is a 60% chance of a 40 – 60 point reversal in August so traders need to be ready.
Al,
Thank you for the analysis. Your ability to read the patterns is so appreciated. Thank you for sharing.