Emini sell signal bar before December 8 continuing budget resolution
I will update around 6:44 a.m.
The Emini sold off in a small pullback bear trend at the end of yesterday. But, the limit order bulls were able to make money. This is an early sign of 2 sided trading and it increases the odds of an early trading range today. Since yesterday’s channel was tight, the 1st rally today will be minor, even if it lasts an hour. This means that it will probably be a bull leg in a trading range. After a test back down, then the bulls have a 40% chance of a successful major trend reversal.
The odds are that today will rally at least 10 points at some point and test the breakout below Monday’s low. After consecutive big bull bars and a failed break below yesterday’s low, the Emini is Always In Long. The odds are that it will either form an early trading range and then test Monday’s low, or just continue straight up to that target. If there is a new low first, the bulls will probably buy it. The odds are against a strong bear trend day for at least a couple of hours.
Pre-Open market analysis
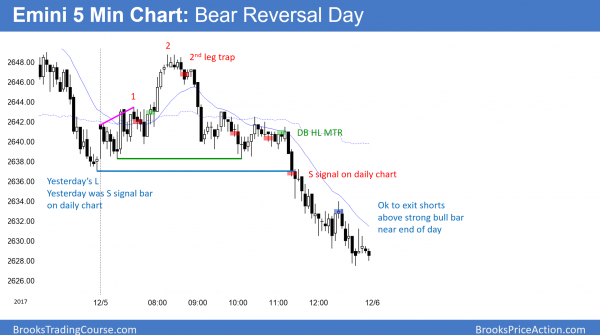
Monday was a sell signal bar on the daily chart. When yesterday traded below Monday’s low, it triggered the sell. Since the daily, weekly, and monthly charts are in extreme buy climaxes, traders need to be ready for a big reversal down coming at any time. However, until there are consecutive strong bear bars on the daily chart, the odds continue to slightly favor higher prices. Since this setup looks particularly good for the bears, it has a better chance of success than all of the other sell signals this year.
Today is important because if it is a 3rd consecutive bear day, the odds will favor at least a 2nd leg down. If that happens, there will probably be sellers above today’s high. Consequently, today’s close is important. This increases the odds of a swing up or down at the end of the day. The bears want today to close below the open to create a 3rd bear day. Therefore, they will try to create a selloff in the final hour if the Emini is above the open. The bulls want the opposite. They will buy at the end of the day if the Emini is about 5 points or less below the open.
Because Friday’s budget vote is a major catalyst, the Emini has an increased chance of being in a tight range until after the vote. Yet, traders always have to be ready for a breakout.
Overnight Emini Globex trading
The Emini is down 2 points in the Globex market. Since yesterday was a sell climax, there is a 50% chance of follow-through selling in the 1st 2 hours. In addition, there is a 75% chance of at least 2 hours of sideways to up trading that starts by the end of the 2nd hour.
Because there have been big swings up and down this week, that will probably continue again today. However, the swings will get smaller and the 5 minute chart will probably enter a trading range before Friday’s budget reconciliation vote. That is a major catalyst and it can therefore lead to a big move up or down.
Yesterday’s setups
Here are several reasonable stop entry setups from yesterday. I sometimes also show limit order entries and entries on the close of bars.
EURUSD Forex market trading strategies
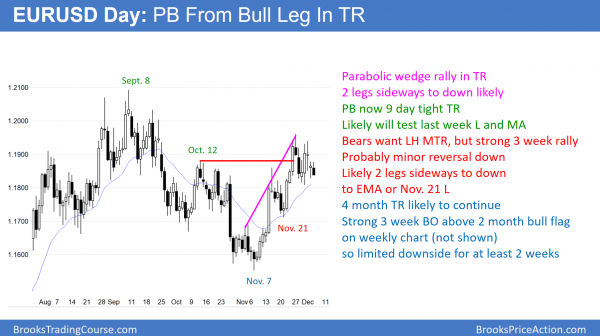
The EURUSD daily Forex chart pulled back to the 20 day exponential moving average. The pullback has 2 legs and is therefore a High 2 bull flag. However, it might continue down to the November 21 major higher low before the bulls try to rally back up to the September high.
The parabolic wedge climax that ended on November 27 was a sign that the bulls were exhausted. When that happens, they take profits and wait for at least 2 legs down to support before buying again. While yesterday was the 2nd leg down and it touched the EMA, it had a bear body. It is therefore a low probability buy signal bar for today. The bulls will try to create a bull bar today or soon so that they will have a more reliable buy signal bar. However, there is a 40% chance that this pullback might continue down to the November 21 major higher low before the bulls buy aggressively again.
The bears want the November rally to be a lower high major trend reversal. However, the 2 week selloff lacks consecutive big bear bars. It is therefore more likely a bull flag than a bear trend. Since Friday’s budget vote and the upcoming tax reform votes are major financial events, traders might wait for both before creating a breakout.
Overnight EURUSD Forex trading
The EURUSD 5 minute chart has continued to have small ranges for the past 2 weeks. Day traders are mostly scalping. Since the pullback has met its minimum objective, the daily chart is now in breakout mode. However, a bull breakout is more likely because the 2 week selloff is more likely a bull flag.
Summary of today’s S&P Emini futures price action and what to expect tomorrow
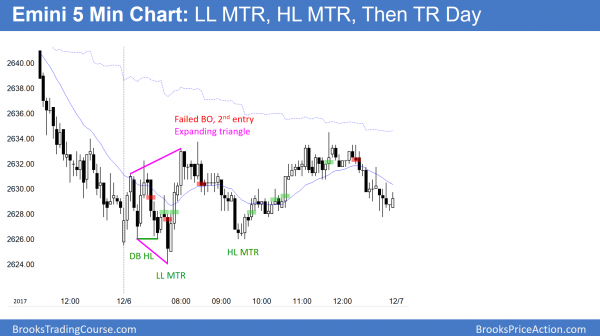
The bulls bought below yesterday’s low and created a lower low major trend reversal. The subsequent higher low major trend reversal led to a 2nd leg up in a trading range day.
The Emini reversed up strongly from a lower low major trend reversal. However, after a deep pullback, the reversal up from the following higher low major trend reversal looked more like a bull leg in a trading range. The Emini was neutral after 2 big bear days. It is still Always In Long on the daily chart.
See the weekly update for a discussion of the price action on the weekly candlestick chart and for what to expect going into next week.
Traders can see the end of the day bar-by-bar price action report by signing up for free at BrooksPriceAction.com. I talk about the detailed S&P Emini futures price action real-time throughout the day in the BrooksPriceAction.com trading room. We offer a 2 day free trial.
When I mention time, it is USA Pacific Standard Time (the Emini day session opens at 6:30 am PST, and closes at 1:15 pm PST). You can read background information on the intraday market reports on the Intraday Market Update page.


Hi Al,
I had a question to ask .. for quite sometime you have been expecting a trend reversal. However, it hasn’t happened ( barring the past 3 days) .. How do u reconcile your personal biases while trading .. i.e. have you been able to go long during the periods when the market was not going down as you expected? How much emphasis do u pay to your personal view..
Your course is very helpful and i have learnt a lot from you so far.
Best,
Nitin
That is a reasonable question, and it is important to distinguish time frames. A bear trend on the daily chart is usually a bull flag on the monthly chart. Also, there are often buying opportunities for fast money traders during bear trends, just as there are selling opportunities in bull trends.
It will probably be helpful to readers who have not been reading my blogs for very long to repeat what I have been saying. I have been concerned about how traders might read my writing. Look back at every post over the past 6 months. I said that the Emini was in a buy climax and the odds favored a 5%, 100 point correction before going much higher. However, in every post, I wrote that any one reversal attempt was more likely to fail than succeed, even though there would eventually be one that succeeded. In addition, I said that buy climaxes can keep growing much longer than what seems possible.
Furthermore, I have consistently said that the reversal would probably be a bull flag on the monthly chart, and either a bull flag or a trading range on the weekly chart. I have said every time that the bulls will buy the pullback.
However, I also said that a 100 point selloff on the daily chart would be a bear trend. That bear trend would be a bull flag on the weekly and monthly charts.
I am holding February put spreads because I think the probably is high that there will be a 100 point correction. My plan is to take profits if the Emini falls 100 points. Since the stock market is in a bull trend, I have been taking short-term trades from the long side as well.
I don’t normally look for tops in tight bull channels. However, this is a special case. The stock market has never been this overbought on the daily, weekly, and monthly charts. That makes the odds off a relatively fast and big correction likely. Without this extreme of a buy climax, I would not be buying puts.
The reason I am holding put spreads is that once a correction begins, it will probably be at least half over before traders believe it is underway. Option prices will be high, and stops for shorts will be big. That makes it hard to short or buy puts. I am holding February puts because buy climaxes can keep growing for a long time and I want to be sure to give enough time for it to end. I have also scaled in as the rally has continued. When I plan to scale in, I trade small so that I can add without incurring too much risk.
Cool Thanks so much Al for such an elaborate answer.. It was indeed helpful!
Best,
Nitin