Market Overview: NASDAQ 100 Emini Futures
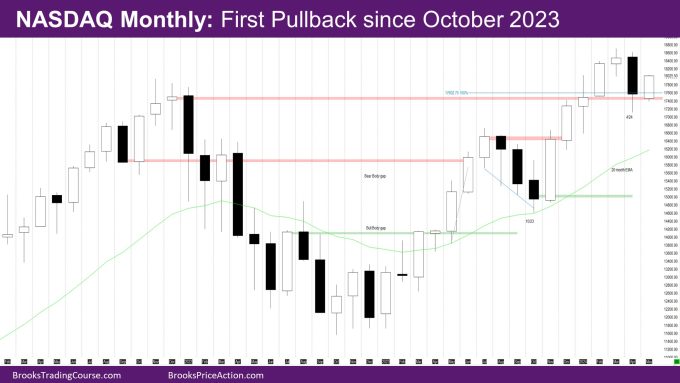
The NASDAQ Emini futures April monthly candlestick is a big bear bar with a prominent tail below. It is the first pullback since October 2023.
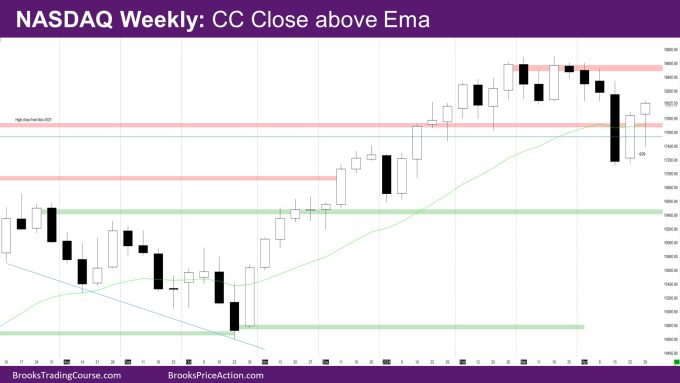
The week is a bull doji bar with a long tail below. The long tail below is likely the 2nd leg for now corresponding to the big move down 2 weeks back.
NASDAQ 100 Emini futures
The Monthly NASDAQ chart

- The April month bar is a big bear bar with a prominent tail below.
- This is the first pullback in the bull micro-channel that started in November 2023.
- The last monthly report had mentioned that bears can still try to close the bull body gap with December 2021 in April.
- The April bar went below the December 2021 high close, but then closed above the December 2021 high close.
- So technically the bull body gap is still open.
- The micro-channel up from November 2023 is likely a spike on a higher timeframe, so there should be a channel phase.
- The market may try a 2nd leg up in April, May and June.
The Weekly NASDAQ chart

- The week is a doji bull bar with a long tail below and a close above last week high.
- Last week’s report had mentioned how the buy signal bar likely had sellers above.
- The tail in this week’s bar was caused by the sellers in the first half of the week after the market triggered the buy signal bar.
- The market then rallied on Thursday and Friday.
- Bears might now wait till a couple of legs up to sell higher.
Market analysis reports archive
You can access all weekend reports on the Market Analysis page.

