Market Overview: Nifty 50 Futures
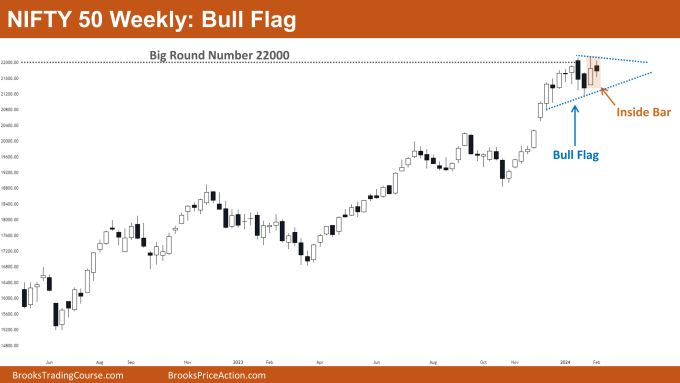
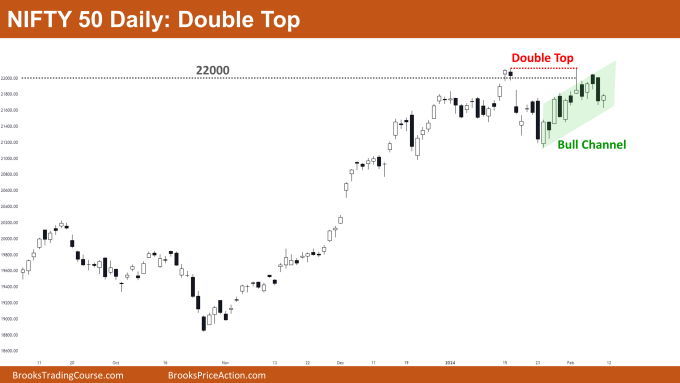
Nifty 50 Bull Flag on the weekly chart. On the weekly chart, Nifty 50 closed weakly bearish this week, with a small-bodied bear bar and tails on both sides. Currently, the market is ensconced within a triangle, which, given its formation within a bull trend, can also be termed a bull flag pattern. Trading near the significant big round number 22000, which acts as robust resistance, most bulls await a robust bull breakout before considering long positions. On the daily chart, the market exhibits increasing trading range price action and resides within a bull channel. Despite attempts by bears to trigger a reversal with a double top pattern, they struggle to generate strong follow-through bars.
Nifty 50 futures
The Weekly Nifty 50 chart

- General Discussion
- Both bulls and bears are advised to exercise caution before initiating new long or short positions, respectively. The market’s current status within a triangle indicates nearly equal probabilities of a successful breakout on either side.
- Bulls currently holding long positions can maintain their trades until a strong bear breakout of the bull flag occurs.
- Deeper into the Price Action
- Nifty 50’s recent trend includes the formation of bars with small bodies, suggesting an uptick in trading range price action that may ultimately lead to a trading range.
- Given the proximity to a significant big round number, traders should anticipate trading range price action in the coming weeks.
- Recent patterns observed on the weekly chart, such as inside bars and outside bars, typically signify trading ranges.
- Patterns
- Despite trading in a strong bull trend, Nifty 50 is not forming a bull flag pattern.
- A successful bull breakout of the bull flag pattern would increase the likelihood of a measured move up based on the pattern’s height.
The Daily Nifty 50 chart

- General Discussion
- Nifty 50 currently trades within a small bull channel, making it challenging for both bulls and bears to profit.
- The market presently resides within a significant trading range, with 22000 serving as a possible top and 21000 as a plausible bottom.
- Traders should focus on buying near the range bottom (21000) and selling near the top (22000).
- Deeper into Price Action
- Bears attempted to establish a significant double top pattern but failed to generate strong follow-through bars downward, indicating a trading range.
- Notably, there’s been an increase in bad follow-through bars after strong bars, with the market alternating between bear and bull bars.
- Patterns
- If bears manage a bear breakout of the bear channel, traders should sell on the breakout and exit upon reaching the bottom of the bull channel.
- Failure by bears to sustain the current bearish leg would likely result in a cup & handle pattern formation, with a measured move up upon a successful bull breakout.
Market analysis reports archive
You can access all weekend reports on the Market Analysis page.

