Market Overview: Bitcoin Futures
Bitcoin is tightening its range on the Daily chart. This past week’s candlestick is a bull doji bar, with a close below its midpoint. The value of a Bitcoin increased 1.64% during the past week.
Bitcoin futures
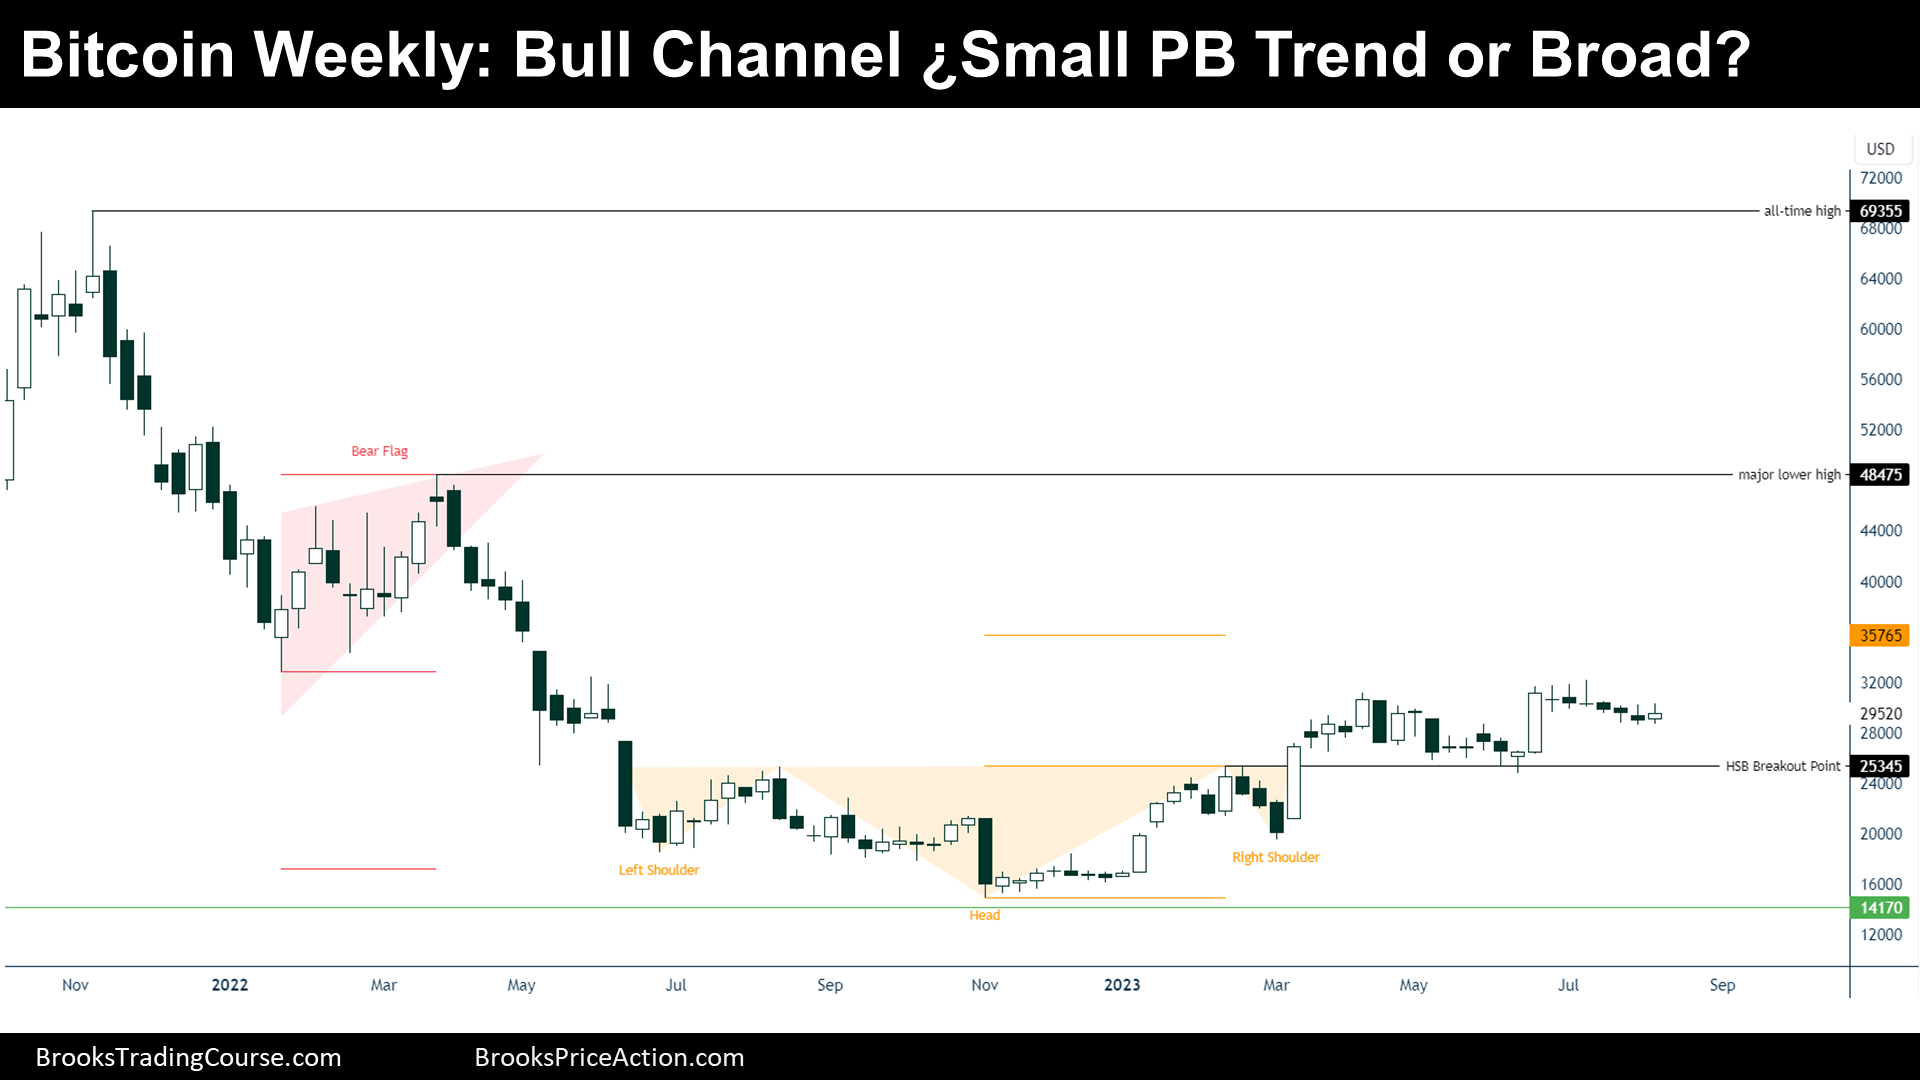
The Weekly chart of Bitcoin futures

Past (Supports & Resistances)
“Every market probes up and down to discover how far is too far, which then becomes support and resistance. Once traders understand this and how to spot logical support and resistance levels, they are in a position to begin trading.” — Al Brooks.
- During 2022, the price created a Bear Flag pattern and then did a strong bear breakout, creating the following resistance levels:
- Major Lower High.
- Bear Flag Breakout Point at $32855.
- Thereafter, the price did a bottoming pattern:
- Head and Shoulders Bottom (HSB).
- Bear Trend Low (2022 low).
- During March 2023, the price did a bull breakout of the HSB:
- HSB Breakout Point.
- HSB Measured Move at $35765.
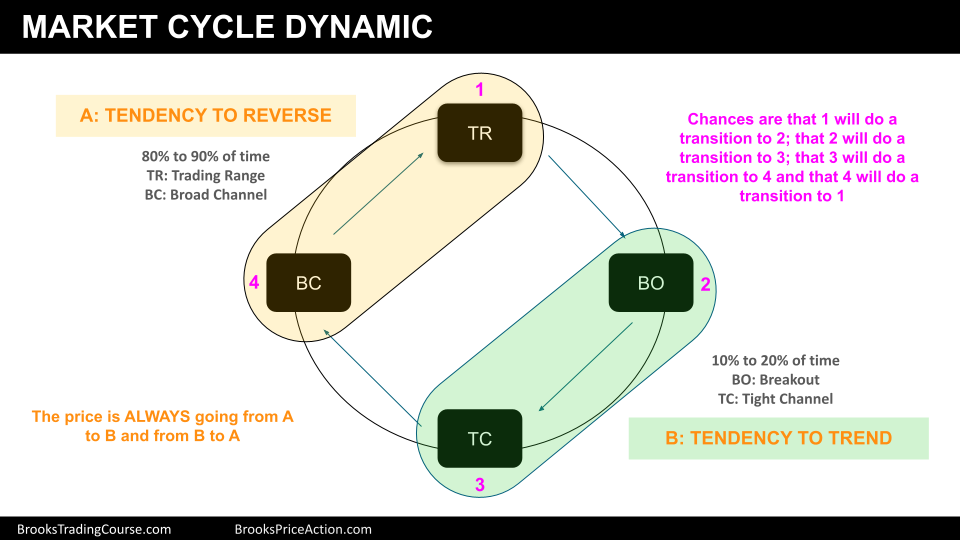
Present (Market Cycle)
The current market cycle is unclear. There is a bull channel and traders wonder if the bull channel is a small pullback bull trend (tight channel), or a broad bull channel.

- In favor of a Small Pullback Bull Trend:
- After the bull breakout of the HSB, the price did a test of the HSB breakout point and then reversed up.
- The price created a Body Gap (Negative Gap), which means that there was not a weekly close below the HSB Breakout Point.
- The price reached a Higher High after the Body Gap.
- After the bull breakout of the HSB, the price did a test of the HSB breakout point and then reversed up.
- In favor of a Broad Bull Channel:
- During the bull channel, there were two 50% retracements of bull legs.
- 2022 was a strong bear trend. The way up is full of trapped bulls that add selling pressure.
During Small Pullback Bull Trends, there is always the sensation that the price it is going to reverse, unless there is a bull breakout after a long duration trend, or consecutive wedges. However, on the left of the chart (“Past” section) there is a strong bear trend, and that it is not positive for Small Pullback Bull Trend trading strategies: bear trends trap bulls into the wrong trade and during a reversal up they sell.

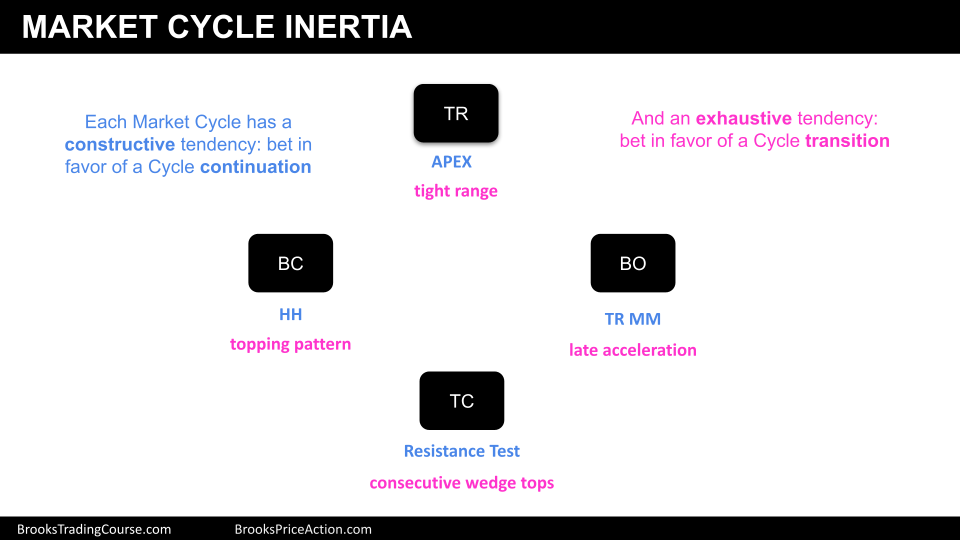
Future (Inertia)
- If Small Pullback Bull Trend:
- The market will test the bear flag breakout point at $32855.
- HSB Measured Move.
- If Broad Bull Channel:
- The market can either trade around the breakout point and then reverse up to reach new highs of the trend.
- Or it can form a Lower High that creates a Head and Shoulders Top pattern.
Trading
- Swing Bulls:
- Small Pullback Bull Trend:
- They will buy at the 20-EMA, a reversal up from 20-EMA, a bull flag or High 2.
- Broad Bull Channel:
- They will buy at or during a reversal up of the HSB breakout point, or at the right shoulder low (major higher low).
- Small Pullback Bull Trend:
- Swing Bears:
- Broad Bull Channel:
- They will sell after a topping pattern is created, such as a wedge top or a Head and Shoulders Top.
- Broad Bull Channel:
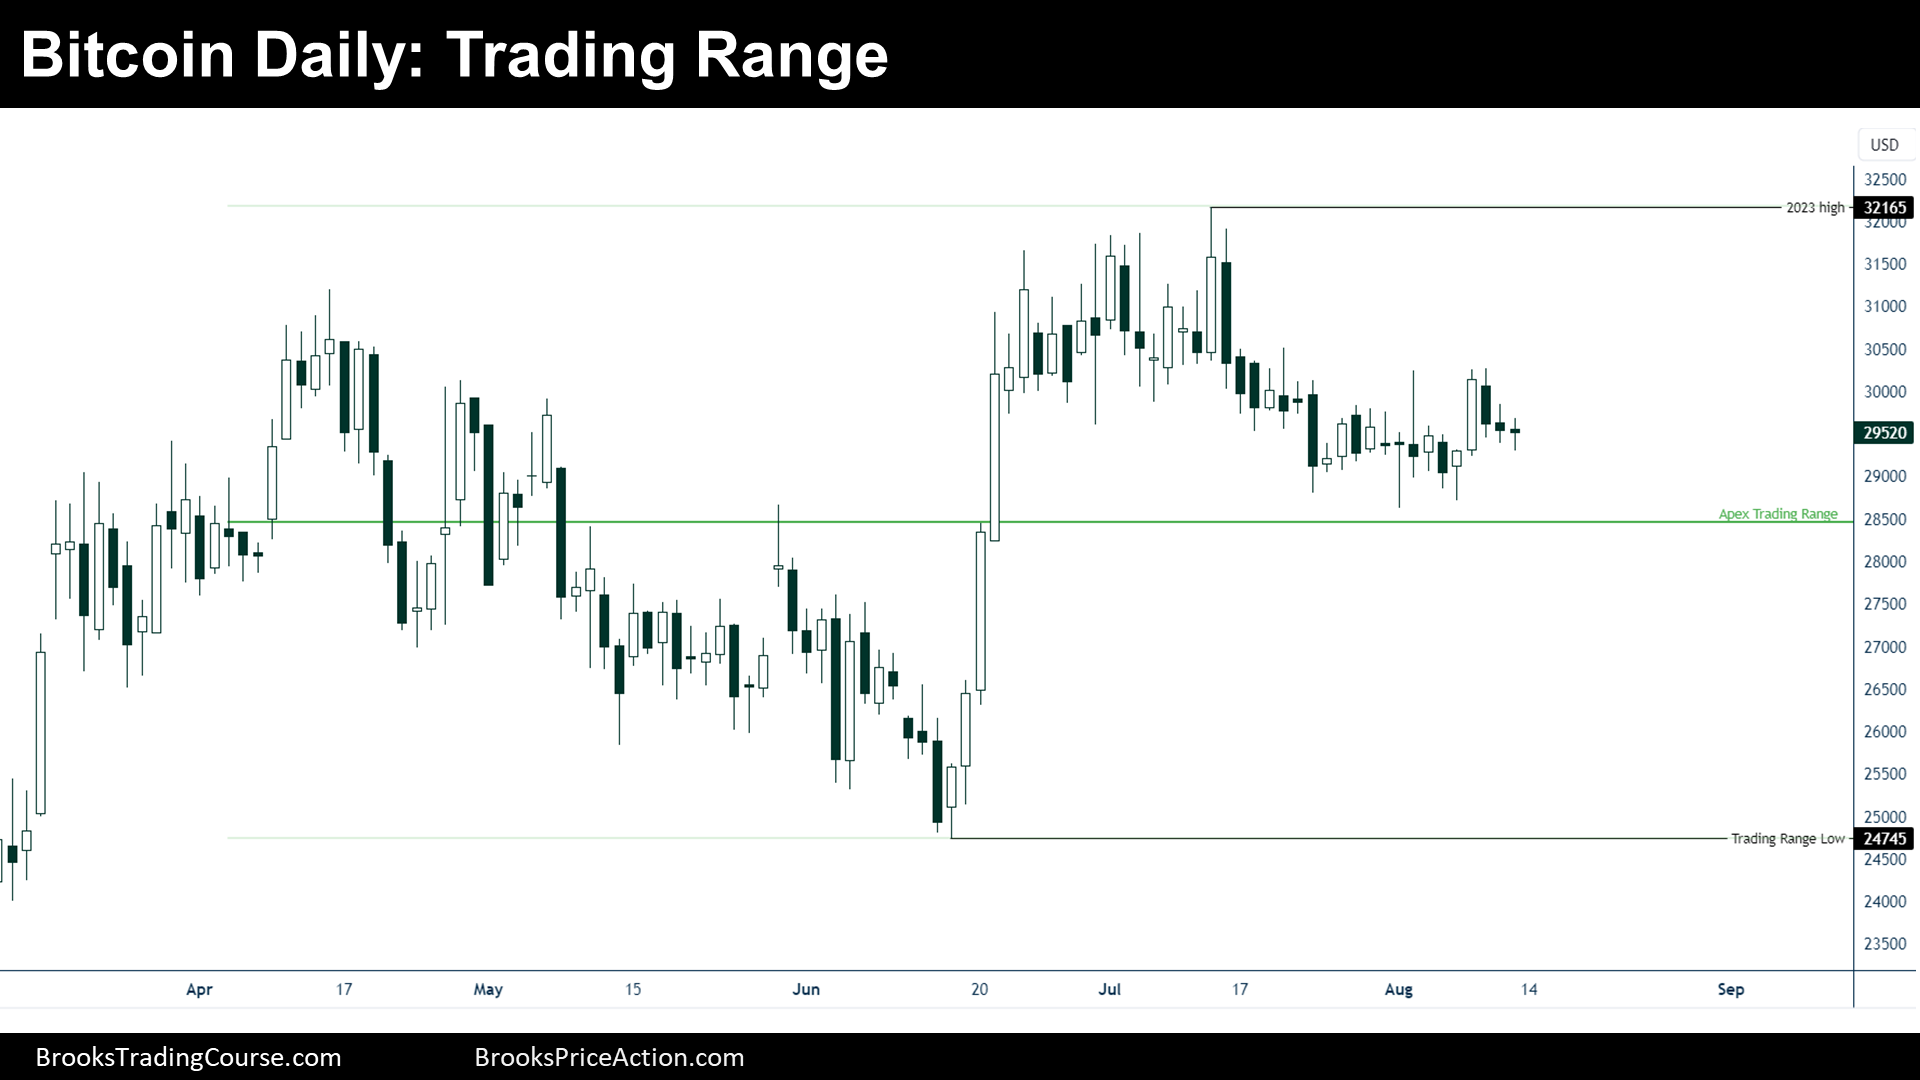
The Daily chart of Bitcoin futures

Past (Supports & Resistances)
- There was a Bull Breakout of a Bull Flag and then the price went sideways.
- The price is probably within a Trading Range.
- The most important levels are the high and the low of the Trading Range.
Present (Market Cycle)
- The bull breakout has lost whole inertia to keep trending up.
- Traders wonder if this is a broad bull channel (or a bull trending range) or if this is just a Trading Range.
- The price is tightening its range, which suggests that there will be a bull or a bear breakout during the next 20 bars or so.
Future (Inertia)
- If Trading Range:
- The market tends to go to the apex of the trading range.
- But it is tightening its range, there might be a breakout soon, one side or the other.
Trading
- Swing Bulls:
- They want to wait until there is a bull breakout.
- Swing Bears:
- They intend to wait until there is a bear breakout.
Market analysis reports archive
You can access all weekend reports on the Market Analysis page.

