Trading Update: Thursday June 15, 2023
S&P Emini pre-open market analysis
Emini daily chart
- The Emini is stalling under important resistance, the August 2022 High.
- The Emini went down outside yesterday, a sign of trading range price action.
- The market came within 14 points of August 2022 high and sold off.
- Because the August high is such an important magnet on the larger time frames, it was reasonable to assume that the Emini could close to the August high but not reach it on the first attempt.
- If traders were long on the weekly chart, expecting a test of the August 2022 high, they would probably be happy to take partial or full profits on a test within 15 points of the August high. The risk is getting too big relative to the reward, so that traders will take partial profits.
- The daily chart may try and form an inside bar with yesterday’s outside down bar. This would create a second entry short (Low 2) following a parabolic wedge (May 30th, June 5th, and June 14th).
- Most parabolic wedges are minor reversals which means the odds will favor a trend resumption of the rally and not a successful reversal.
- The market will still probably get to the August 2022, even if it pulls back first.
- The bears need to create more selling pressure if they will get a reversal. Even if the bears get consecutive bear trend bars, the probability will still favor sideways. If the Bears can get a strong trendline break of the June rally and a double top with the June 14th high, they will have a reasonable chance of getting a reversal.
- Overall, today will probably disappoint the bulls and lead to more profit-taking. However, the profit-taking will likely be brief, and the market will get closer to the August 2022 high.
Emini 5-minute chart and what to expect today
- Emini is down 12 points in the overnight Globex session.
- There were several reports released during 5:30 AM PT this morning. The bears got a downside breakout that failed and reversed up.
- The downside breakout during the report was likely to fail since the market was late in a bear channel.
- The 5:40 AM PT (5 min) bear breakout bar was big, which increased the odds of it being an exhaustion bar.
- This led to the potential for a rally lasting a few hours, which means the open might have an upward bias.
- Traders should be neutral on the open and assume that the market will have a lot of trading range price action. If traders want a higher probability, they should wait for 6-12 bars of sideways trading before placing a trade.
- Most traders should wait for the opening swing to form. Typically the opening swing will form after a double top/bottom or a wedge top/bottom 80% of the time. This means there is only a 20% chance of a bull trend from the open.
- Lastly, traders should always remember that they must never be in denial of the price action. Remember, as Al Brooks often says, “Price is truth.” You must trade what the market is in front of you, not what you hope the market will do.
Emini intraday market update
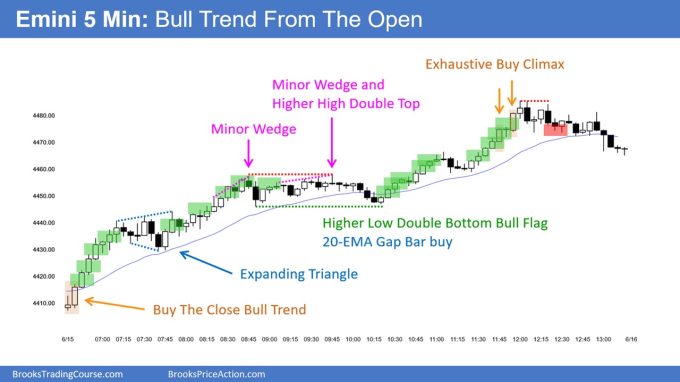
- The Emini formed a bull trend from the open and reached the August 2022.
- There is a 60% chance that this trend from the open will form a trading range and not last all day.
- The odds of the market converting into a bear trend or returning to the day’s open are small.
- As of bar 30 (9:00 AM PT), the bears have developed some selling pressure. However, they need to do more.
- At a minimum, the bears need to break the trend line of the bull channel that started at 7:40 AM PT) low. Ideally, the bears need to break below the moving average as well.
- If the bears can break the bull trendline, that will be enough to transition the market into a trading range; however, the market will likely need many bars sideways before the bears have a credible chance at getting a major trend reversal.
Yesterday’s Emini setups

Al created the SP500 Emini charts.
Here are several reasonable stop entry setups from yesterday. I show each buy entry with a green rectangle and each sell entry with a red rectangle. Buyers of both the Brooks Trading Course and Encyclopedia of Chart Patterns have access to a near 4-year library of more detailed explanations of swing trade setups (see Online Course/BTC Daily Setups). Encyclopedia members get current daily charts added to Encyclopedia.
My goal with these charts is to present an Always In perspective. If a trader was trying to be Always In or nearly Always In a position all day, and he was not currently in the market, these entries would be logical times for him to enter. These therefore are swing entries.
It is important to understand that most swing setups do not lead to swing trades. As soon as traders are disappointed, many exit. Those who exit prefer to get out with a small profit (scalp), but often have to exit with a small loss.
If the risk is too big for your account, you should wait for trades with less risk or trade an alternative market like the Micro Emini.
EURUSD Forex market trading strategies
EURUSD Forex daily chart

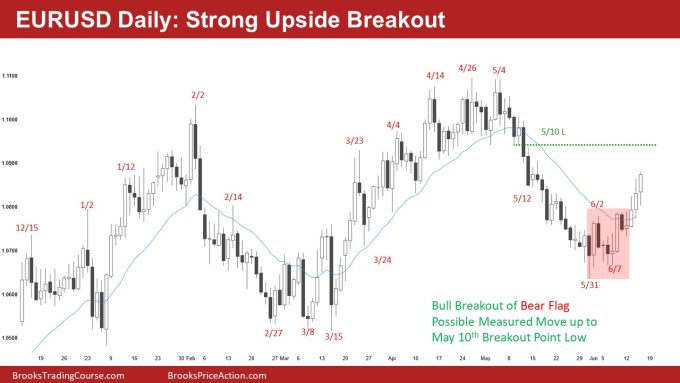
- The EURUSD is continuing to get follow-through buying after the recent upside breakout.
- The bulls see this as a bull breakout of the bear flag (red box). They want a measure move up of the bear flag and a test up to the May 10th breakout point low, which they probably will get.
- The daily chart is in an overall trading range. Trading ranges are typically forgiving of traders who use wide stops and scale in. This means that the bulls who bought May 10th low and scaled in lower will probably be able to make money.
- The tails above the past two trading days are disappointing for the bulls and a sign that there is profit taking above. This increases the odds of a deep pullback.
- The bears see the rally over the past two days as a 50% pullback of the selloff from the May high.
- Even if the market has a deep pullback, it will still likely get back up to the May 10th low due to all of the trading range price action on the daily chart.
- Overall, traders will pay close attention to today to see how today’s bull close will look. Since the market is in a trading range, today will probably disappoint the bulls.
Summary of today’s S&P Emini price action

Al created the SP500 Emini charts.
End of day video review
Here is YouTube link if your browser blocks video popup:
Emini End of Day Video Review for Thursday June 15, 2023
See the weekly update for a discussion of the price action on the weekly chart and for what to expect going into next week.
Trading Room
Al Brooks and other presenters talk about the detailed Emini price action real-time each day in the BrooksPriceAction.com trading room days. We offer a 2 day free trial.
Charts use Pacific Time
When times are mentioned, it is USA Pacific Time. The Emini day session charts begin at 6:30 am PT and end at 1:15 pm PT which is 15 minutes after the NYSE closes. You can read background information on the market reports on the Market Update page.


I reaaly appreciate your analysis, but can you please post a copy of your daily chart because your chart is wrong. We’re way past August 2022 High on every single chart (SPX, ES, SPY). Thanks.
You can check his EOD VDO review that his data, 16 August 2022 High, from Trade Station is 4464.75, which is also different from my TradingView data from CME which is 4327.50. So his data is not wrong. He just read from his data.
SPX is also 4325.28. ES on Thinkorswim also is at 4327.50